
Elasticsearch Transforms: Total Duration from Multiple Status Updates
Elasticsearch Transforms let you
- convert existing documents into summarized ones (pivot transforms) or
- find the latest document having a specific unique key (latest transforms).
This entity-centric view can be helpful for various kinds of data that consist of multiple documents like user behavior or sessions. For example, the duration of a session or a request in a distributed system is a common scenario. The following post is based on a StackOverflow question that is coming up repeatedly in minor variations — use it as a blueprint.
Sample Data #
There are three different entities with the uniqueIDs A, B, and C. Each one of them can have multiple status updates with eventStart.timestamp or eventStop.timestamp:
PUT test/_doc/1
{
  "uniqueID": "A",
  "eventStart": {
    "timestamp": "2020-07-01T13:50:55.000Z"
  }
}
PUT test/_doc/2
{
  "uniqueID": "A",
  "eventStop": {
    "timestamp": "2020-07-01T13:51:00.000Z"
  }
}
PUT test/_doc/3
{
  "uniqueID": "B",
  "eventStart": {
    "timestamp": "2020-07-01T13:52:25.000Z"
  }
}
PUT test/_doc/4
{
  "uniqueID": "B",
  "eventStop": {
    "timestamp": "2020-07-01T13:53:00.000Z"
  }
}
PUT test/_doc/5
{
  "uniqueID": "A",
  "eventStop": {
    "timestamp": "2020-07-01T13:54:55.000Z"
  }
}
PUT test/_doc/6
{
  "uniqueID": "C",
  "eventStart": {
    "timestamp": "2020-07-01T13:54:55.000Z"
  }
}
Relying on the default mapping, the two date and the keyword fields are relevant for calculating the different durations:
# Request
GET test/_mapping

# Response
{
  "test" : {
    "mappings" : {
      "properties" : {
        "eventStart" : {
          "properties" : {
            "timestamp" : {
              "type" : "date"
            }
          }
        },
        "eventStop" : {
          "properties" : {
            "timestamp" : {
              "type" : "date"
            }
          }
        },
        "uniqueID" : {
          "type" : "text",
          "fields" : {
            "keyword" : {
              "type" : "keyword",
              "ignore_above" : 256
            }
          }
        }
      }
    }
  }
}
Transforms API #
The approach for the calculation is:
- Group by the
uniqueID. - Get the first
eventStartand the lasteventStoptimestamp. - Calculate the time difference (in seconds).
While Kibana provides a UI on top of the Elasticsearch Transform API to click together a job, this example sticks to the Elasticsearch API, which is easier to follow along and reproduce. One handy API is preview with POST _transform/_preview.
Starting with the first step of grouping and since the aggregations part is mandatory, counting the number of status updates:
# Request
POST _transform/_preview
{
  "source": {
    "index": "test"
  },
  "dest": {
    "index": "test_transformed"
  },
  "pivot": {
    "group_by": {
      "id": {
        "terms": {
          "field": "uniqueID.keyword"
        }
      }
    },
    "aggregations": {
      "event_count": {
        "value_count": {
          "field": "_id"
        }
      }
    }
  }
}

# Response
{
  "preview" : [
    {
      "event_count" : 3,
      "id" : "A"
    },
    {
      "event_count" : 2,
      "id" : "B"
    },
    {
      "event_count" : 1,
      "id" : "C"
    }
  ],
  "generated_dest_index" : {
    "mappings" : {
      "_meta" : {
        "_transform" : {
          "transform" : "transform-preview",
          "version" : {
            "created" : "7.13.1"
          },
          "creation_date_in_millis" : 1626059453830
        },
        "created_by" : "transform"
      },
      "properties" : {
        "event_count" : {
          "type" : "long"
        },
        "id" : {
          "type" : "keyword"
        }
      }
    },
    "settings" : {
      "index" : {
        "number_of_shards" : "1",
        "auto_expand_replicas" : "0-1"
      }
    },
    "aliases" : { }
  }
}
For the final result it is “just” missing the right aggregation(s): The bucket script aggregation sounds promising.
Transforms with Bucket Script Aggregation #
Continuing the previous transformation, this one adds the earliest start timestamp, the latest end timestamp, and the duration between the two:
# Request
POST _transform/_preview
{
  "source": {
    "index": "test"
  },
  "dest": {
    "index": "test_transformed"
  },
  "pivot": {
    "group_by": {
      "id": {
        "terms": {
          "field": "uniqueID.keyword"
        }
      }
    },
    "aggregations": {
      "event_count": {
        "value_count": {
          "field": "_id"
        }
      },
      "start": {
        "min": {
          "field": "eventStart.timestamp"
        }
      },
      "stop": {
        "max": {
          "field": "eventStop.timestamp"
        }
      },
      "duration": {
        "bucket_script": {
          "buckets_path": {
            "start": "start.value",
            "stop": "stop.value"
          },
          "script": """
            return (params.stop - params.start)/1000;
          """
        }
      }
    }
  }
}

# Response
{
  "preview" : [
    {
      "duration" : 240.0,
      "stop" : "2020-07-01T13:54:55.000Z",
      "event_count" : 3,
      "start" : "2020-07-01T13:50:55.000Z",
      "id" : "A"
    },
    {
      "duration" : 35.0,
      "stop" : "2020-07-01T13:53:00.000Z",
      "event_count" : 2,
      "start" : "2020-07-01T13:52:25.000Z",
      "id" : "B"
    },
    {
      "stop" : null,
      "event_count" : 1,
      "start" : "2020-07-01T13:54:55.000Z",
      "id" : "C"
    }
  ],
  ...
The calculation in Painless is surprisingly simple: (params.stop - params.start)/1000:
- More complicated datetime APIs aren’t needed. Every
datein Elasticsearch is stored as alongsince the epoche in milliseconds, so a simple difference is enough. - Moving to seconds is a division by 1,000.
- Missing end times are automatically handled.
To create the transform job and not just preview it, you need to adjust the request to the following:
PUT _transform/test_duration
{
  "description": "Calculate the duration of an event from multiple status updates (based on its uniqueID)",
  "frequency": "1m",
  "source": {
    "index": "test"
  },
  "dest": {
    "index": "test_transformed"
  },
  "pivot": {
    "group_by": {
      "id": {
        "terms": {
          "field": "uniqueID.keyword"
        }
      }
    },
    "aggregations": {
      "event_count": {
        "value_count": {
          "field": "_id"
        }
      },
      "start": {
        "min": {
          "field": "eventStart.timestamp"
        }
      },
      "stop": {
        "max": {
          "field": "eventStop.timestamp"
        }
      },
      "duration": {
        "bucket_script": {
          "buckets_path": {
            "start": "start.value",
            "stop": "stop.value"
          },
          "script": """
            return (params.stop - params.start)/1000;
          """
        }
      }
    }
  }
}
With GET _transform/test_duration you can see the transform job. And you must explicitly start it with POST _transform/test_duration/_start — otherwise it won’t do anything.
Finally, the stats API is great to see what the job is or has been up to:
# Request
GET _transform/test_duration/_stats

# Response
{
  "count" : 1,
  "transforms" : [
    {
      "id" : "test_duration",
      "state" : "stopped",
      "stats" : {
        "pages_processed" : 2,
        "documents_processed" : 6,
        "documents_indexed" : 3,
        "documents_deleted" : 0,
        "trigger_count" : 1,
        "index_time_in_ms" : 41,
        "index_total" : 1,
        "index_failures" : 0,
        "search_time_in_ms" : 20,
        "search_total" : 2,
        "search_failures" : 0,
        "processing_time_in_ms" : 2,
        "processing_total" : 2,
        "delete_time_in_ms" : 0,
        "exponential_avg_checkpoint_duration_ms" : 114.0,
        "exponential_avg_documents_indexed" : 3.0,
        "exponential_avg_documents_processed" : 6.0
      },
      "checkpointing" : {
        "last" : {
          "checkpoint" : 1,
          "timestamp_millis" : 1626063846766
        },
        "changes_last_detected_at" : 1626063846766
      }
    }
  ]
}
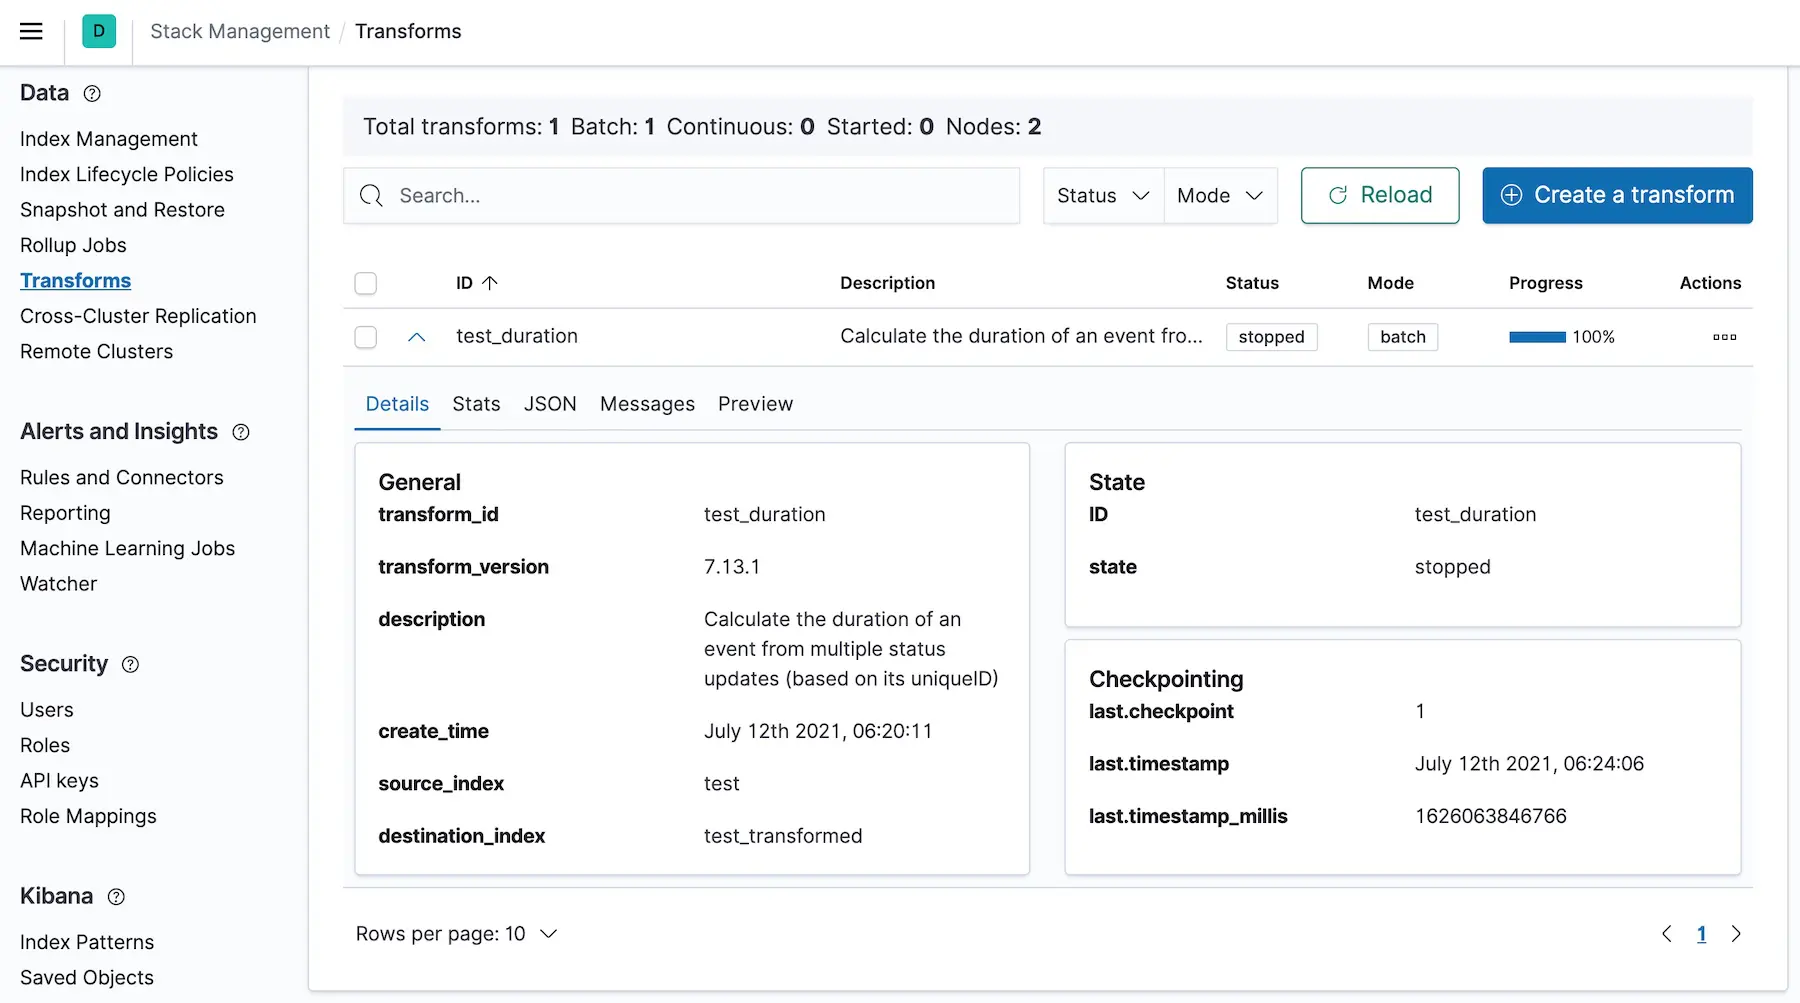
And Kibana gets to the same result:
Last but not least, these are the generated documents:
# Request
GET test_transformed/_search

# Response
{
  "took" : 0,
  "timed_out" : false,
  "_shards" : {
    "total" : 1,
    "successful" : 1,
    "skipped" : 0,
    "failed" : 0
  },
  "hits" : {
    "total" : {
      "value" : 3,
      "relation" : "eq"
    },
    "max_score" : 1.0,
    "hits" : [
      {
        "_index" : "test_transformed",
        "_type" : "_doc",
        "_id" : "QRRx52klPRvG45a5oLgZ95sAAAAAAAAA",
        "_score" : 1.0,
        "_source" : {
          "duration" : 240.0,
          "stop" : "2020-07-01T13:54:55.000Z",
          "event_count" : 3,
          "start" : "2020-07-01T13:50:55.000Z",
          "id" : "A"
        }
      },
      {
        "_index" : "test_transformed",
        "_type" : "_doc",
        "_id" : "Qq7col5MOHvjTNMiAGonnqAAAAAAAAAA",
        "_score" : 1.0,
        "_source" : {
          "duration" : 35.0,
          "stop" : "2020-07-01T13:53:00.000Z",
          "event_count" : 2,
          "start" : "2020-07-01T13:52:25.000Z",
          "id" : "B"
        }
      },
      {
        "_index" : "test_transformed",
        "_type" : "_doc",
        "_id" : "Q-N5zMGevsgbxCl0WsHH6CIAAAAAAAAA",
        "_score" : 1.0,
        "_source" : {
          "stop" : null,
          "event_count" : 1,
          "start" : "2020-07-01T13:54:55.000Z",
          "id" : "C"
        }
      }
    ]
  }
}
That’s it for calculating the duration 🥳
Aggregation without Transforms #
Do you need transforms for getting this result? No.
With some small modifications, you can get the same result with a regular aggregation:
# Request
POST test/_search
{
  "size": 0,
  "aggregations": {
    "group_by": {
      "terms": {
        "field": "uniqueID.keyword"
      },
      "aggregations": {
        "start": {
          "min": {
            "field": "eventStart.timestamp"
          }
        },
        "stop": {
          "max": {
            "field": "eventStop.timestamp"
          }
        },
        "duration": {
          "bucket_script": {
            "buckets_path": {
              "start": "start.value",
              "stop": "stop.value"
            },
            "script": """
              return (params.stop - params.start)/1000;
            """
          }
        }
      }
    }
  }
}

# Response
{
  "took" : 9,
  "timed_out" : false,
  "_shards" : {
    "total" : 1,
    "successful" : 1,
    "skipped" : 0,
    "failed" : 0
  },
  "hits" : {
    "total" : {
      "value" : 6,
      "relation" : "eq"
    },
    "max_score" : null,
    "hits" : [ ]
  },
  "aggregations" : {
    "group_by" : {
      "doc_count_error_upper_bound" : 0,
      "sum_other_doc_count" : 0,
      "buckets" : [
        {
          "key" : "A",
          "doc_count" : 3,
          "stop" : {
            "value" : 1.593611695E12,
            "value_as_string" : "2020-07-01T13:54:55.000Z"
          },
          "start" : {
            "value" : 1.593611455E12,
            "value_as_string" : "2020-07-01T13:50:55.000Z"
          },
          "duration" : {
            "value" : 240.0
          }
        },
        {
          "key" : "B",
          "doc_count" : 2,
          "stop" : {
            "value" : 1.59361158E12,
            "value_as_string" : "2020-07-01T13:53:00.000Z"
          },
          "start" : {
            "value" : 1.593611545E12,
            "value_as_string" : "2020-07-01T13:52:25.000Z"
          },
          "duration" : {
            "value" : 35.0
          }
        },
        {
          "key" : "C",
          "doc_count" : 1,
          "stop" : {
            "value" : null
          },
          "start" : {
            "value" : 1.593611695E12,
            "value_as_string" : "2020-07-01T13:54:55.000Z"
          }
        }
      ]
    }
  }
}
While the structure of the result is different, the result is the same — some additional notes:
- No need to retrieve the underlying documents, which
"size": 0does. - Inside a terms aggregation the other sub aggregations run.
- How many status updates are involved is automatically counted in the
doc_countso thevalue_countisn’t needed. - The
bucket_scriptis the same.
Conclusion #
Hopefully, this is a useful blueprint for transforms or equivalent aggregations. Happy calculations now that you know how all the pieces fit together and which traps to avoid (like starting the transform job).
The documentation also describes when (not) to use transforms, which leads to the classic “it depends” discussion:

When Should You Use Transforms? #
- If you have a large amount of data and the complete aggregation might be too slow or resource-intensive, especially when queried frequently or shown in a large dashboard.
- If you want to clean up your data to save some disk space and only care about the entity-centric view and not every status update.
- If working with the entity-centric documents is simpler — either through the Elasticsearch API or in Kibana. For example, calculating the average, mean, or 99th percentile of durations in Kibana is straightforward with the transform but a lot more challenging without.
When Should You Not Use Transforms? #
- If you require up-to-date results and the (configurable)
frequencymight be an issue. - If you are reading the data so infrequently, the transform job’s overhead isn’t worth it.
Can You Use Runtime Fields Instead? #
- Runtime fields solve a different problem and only add or override fields within a document.
- You could run an aggregation on top of runtime fields, but they alone don’t provide any cross-document features.