
Elastic Stack 8.0.0-alpha2 Up and Running
Elastic Stack 8.0.0-alpha2 just came out and this is a quick (and inofficial) guide to get it up and running. More features, documentation, and announcements are coming, but the venturous can already start: Get Elasticsearch, Kibana, and Agent on Docker up and running in minutes.
Please note:
- This is an alpha. Only use it for testing, and don’t expect an upgrade path to the final 8.0.0 release.
- Expect bugs and rough edges. That’s why we are running the Elastic Pioneer Program again, so we can iron out as many issues as possible.
- This is a minimal example to keep it simple, like skipping TLS certificates (though this might change). Please don’t use it as a template for production.
Elasticsearch #
Before getting Elasticsearch up and running, some Docker housekeeping. Create an elastic network where the Elastic Stack will run:
docker network create elastic
Create an elasticsearch volume where the Elasticsearch data will be mounted. Strictly speaking, it isn’t required to use a volume, but it is always recommended:
docker volume create elasticsearch
Now it’s time to start a single (discovery.type=single-node) Elasticsearch node using the elasticsearch volume and elastic network while also exposing it to the (local) host on the default port of 9200. The --name will come in handy when the other components in the stack are going to reference it. And xpack.security.authc.api_key.enabled — for creating the Agent’s API keys — needs to be enabled when TLS isn’t set up:
docker run --name elasticsearch \
  --publish 127.0.0.1:9200:9200 --net elastic \
  --env discovery.type=single-node \
  --env xpack.security.authc.api_key.enabled=true \
  --volume='elasticsearch:/usr/share/elasticsearch/data' \
  docker.elastic.co/elasticsearch/elasticsearch:8.0.0-alpha2
While Elasticsearch is (hopefully) starting up correctly and a good amount of logging information is scrolling by, watch out for a block similar to this:
-----------------------------------------------------------------

Password for the elastic user is: 2FdhvjxANfpCudI7URy4

Password for the kibana_system user is: E0elIR=kUbVka7f4AHZs

Please note these down as they will not be shown again.


You can use 'bin/elasticsearch-reset-elastic-password' at any time
in order to reset the password for the elastic user.

You can use 'bin/elasticsearch-reset-kibana-system-password' at any time
in order to reset the password for the kibana_system user.

-----------------------------------------------------------------
Yes, security is enabled for all licenses by default for 8.0.0-alpha2 and higher. Making this work for single- but especially multi-node clusters is pretty cool and deserves its own blog post. For now, keep note of both auto-generated passwords (yours will be different) since you will need them soon.
After giving Elasticsearch half a minute or so to start up, try to connect to it with cURL, which will prompt you for the password of the elastic user — including the response here:
curl -u elastic http://localhost:9200/
Enter host password for user 'elastic':
{
  "name" : "307e785212f8",
  "cluster_name" : "docker-cluster",
  "cluster_uuid" : "YzYnB-JhTFucb9JAuClrTA",
  "version" : {
    "number" : "8.0.0-alpha2",
    "build_flavor" : "default",
    "build_type" : "docker",
    "build_hash" : "c4aef6f1a6b450952de62640948d2501c85eecec",
    "build_date" : "2021-09-11T00:50:06.655031460Z",
    "build_snapshot" : false,
    "lucene_version" : "8.9.0",
    "minimum_wire_compatibility_version" : "7.16.0",
    "minimum_index_compatibility_version" : "7.0.0"
  },
  "tagline" : "You Know, for Search"
}
Elasticsearch is up and running. But you probably want to add Kibana as well…
Kibana #
You need to set your auto-generated password of the kibana_system user here, and you are good to go:
docker run --name kibana \
  --publish 127.0.0.1:5601:5601 --net elastic \
  --env ELASTICSEARCH_USERNAME=kibana_system \
  --env ELASTICSEARCH_PASSWORD='E0elIR=kUbVka7f4AHZs' \
  docker.elastic.co/kibana/kibana:8.0.0-alpha2
 After half a minute or so for Kibana to start up, open http://localhost:5601 in your browser. It will redirect you to the login page, where you can use the
 elastic user with your auto-generated password.
Don’t get confused by the two default users: The kibana_system one is for Kibana itself, while the elastic one is for you. However, you should add users for your requirements with only the necessary permissions for any real-world setups.
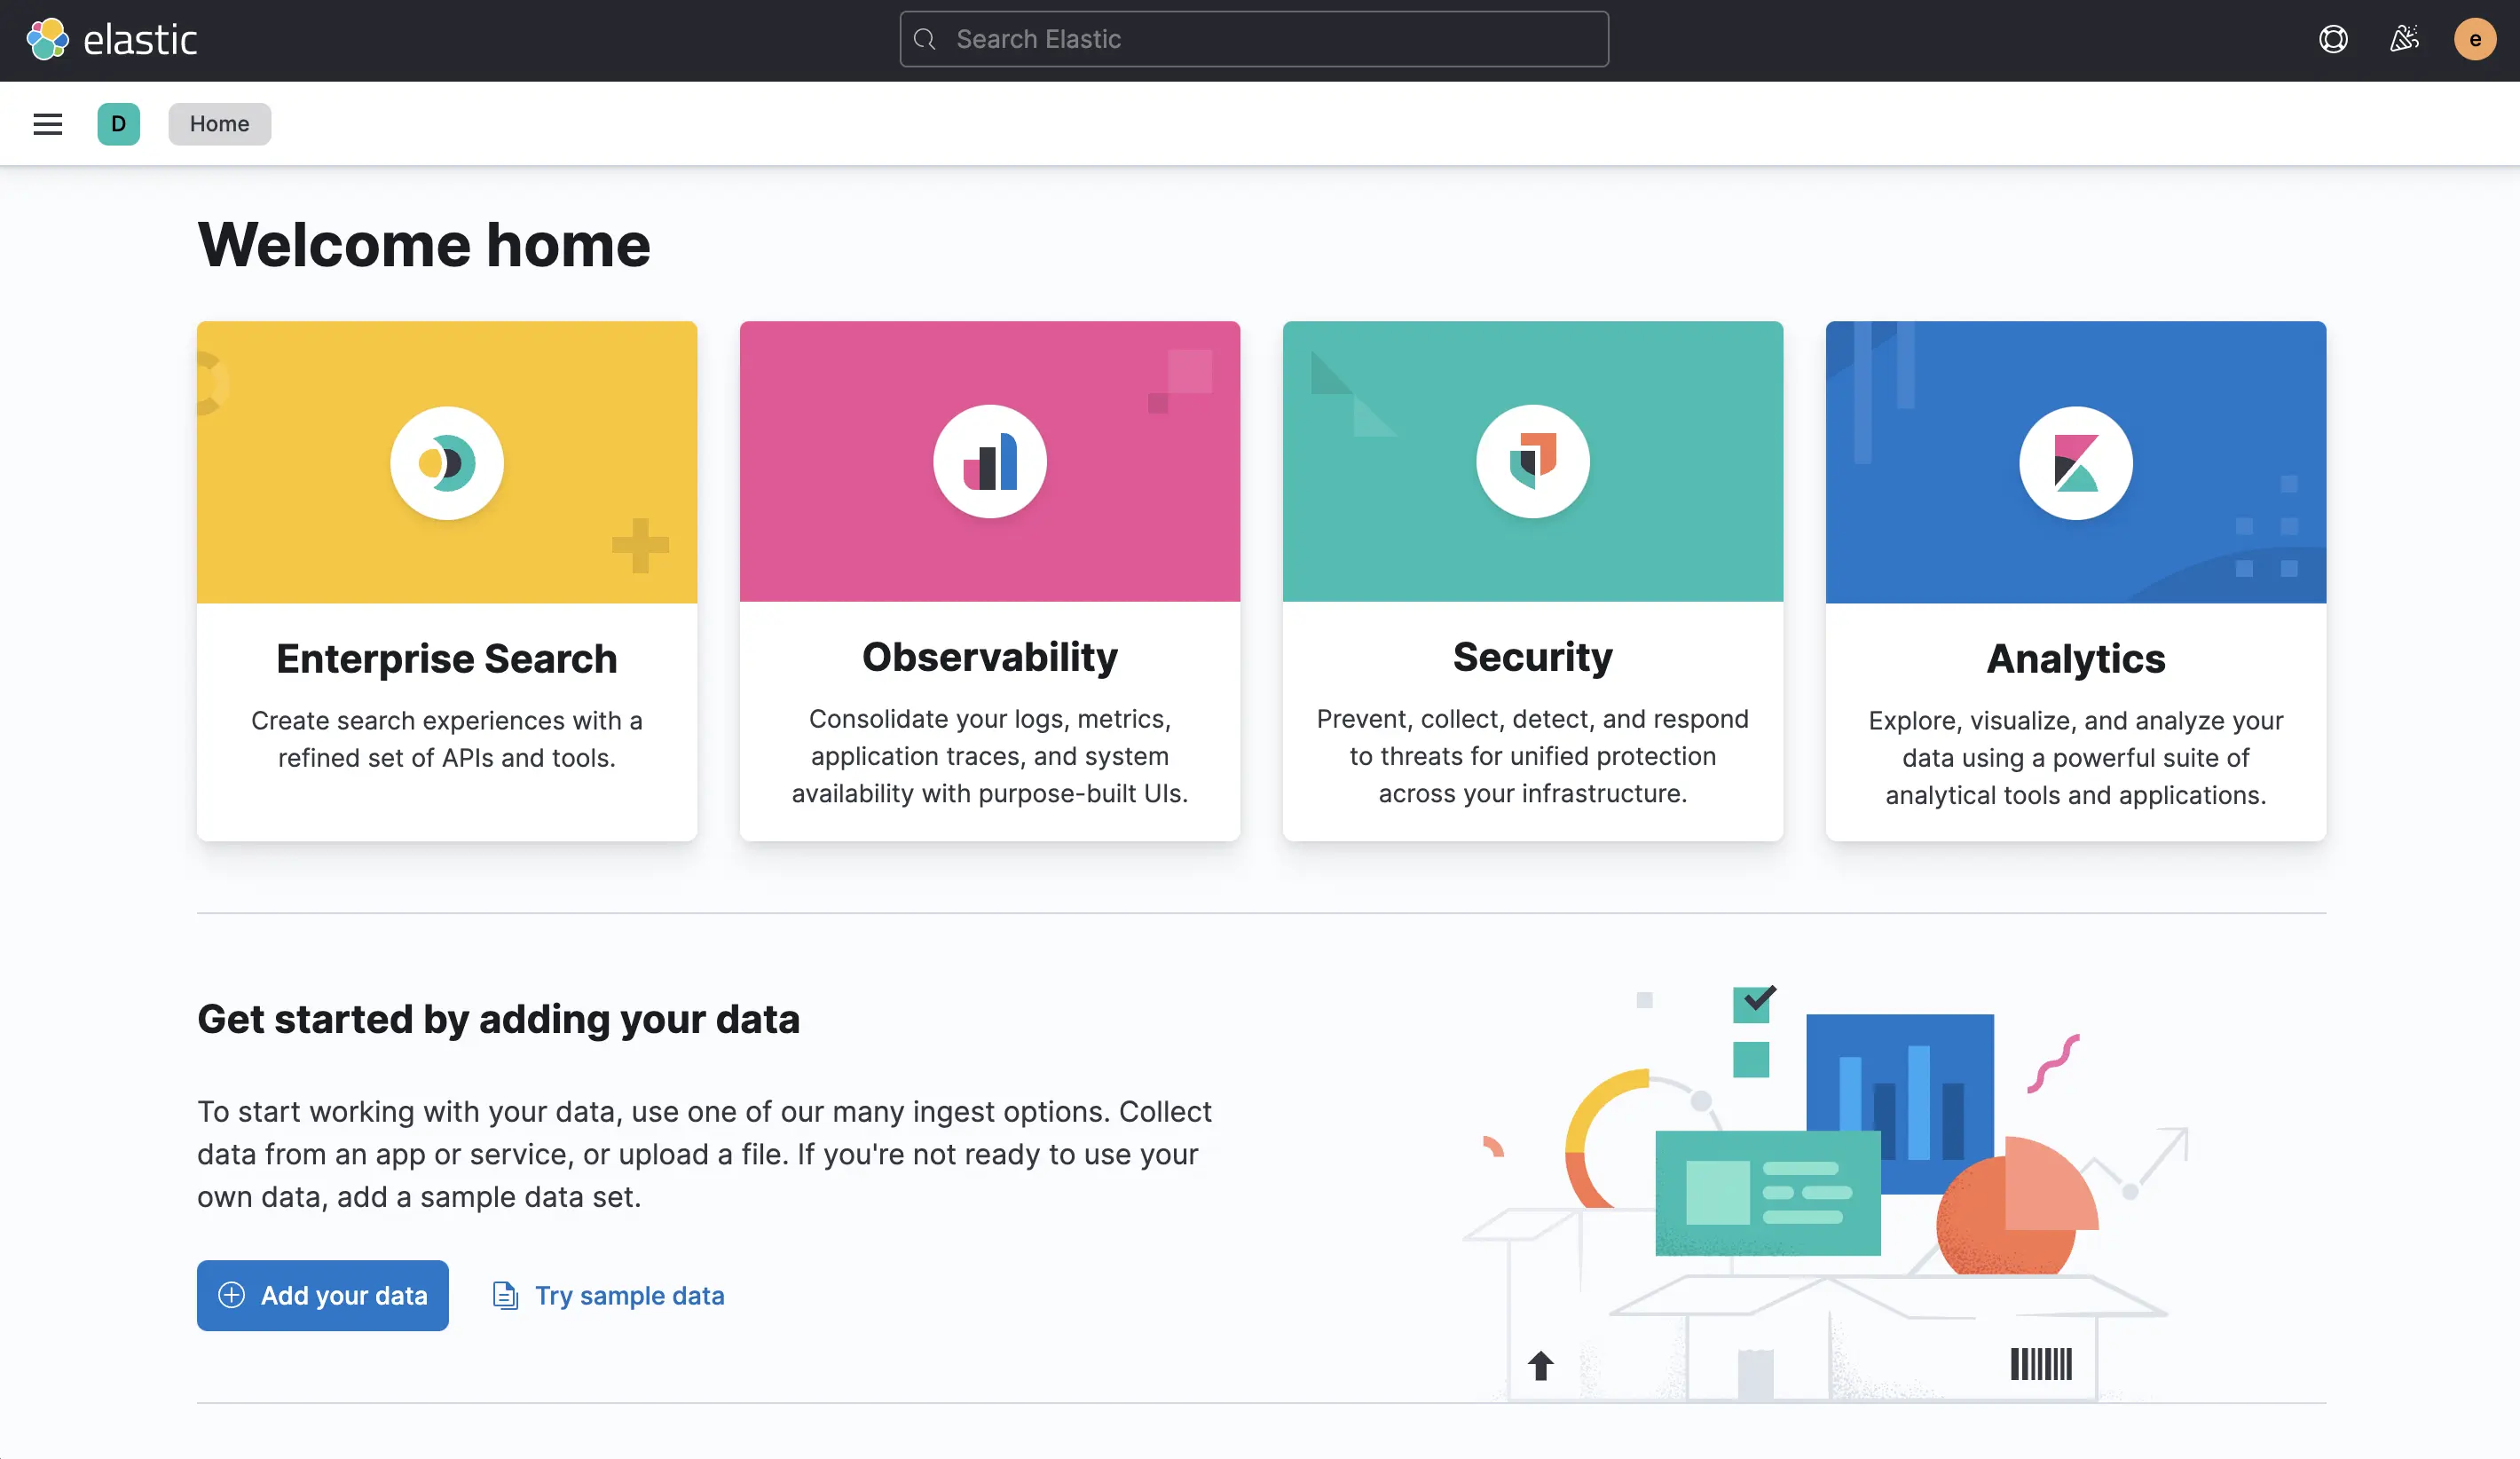 Kibana is up and running. But you probably want to add some data to it…
Agent #
While there are a couple of ways to get data into the Elastic Stack, Elastic Agent and Fleet are one of the more recent and interesting ones. It only takes a few steps to get to a fully UI-driven data collection pipeline. If UI-driven is great for production is a discussion for another day, but for today’s quick demo, it’s a great way to get started.
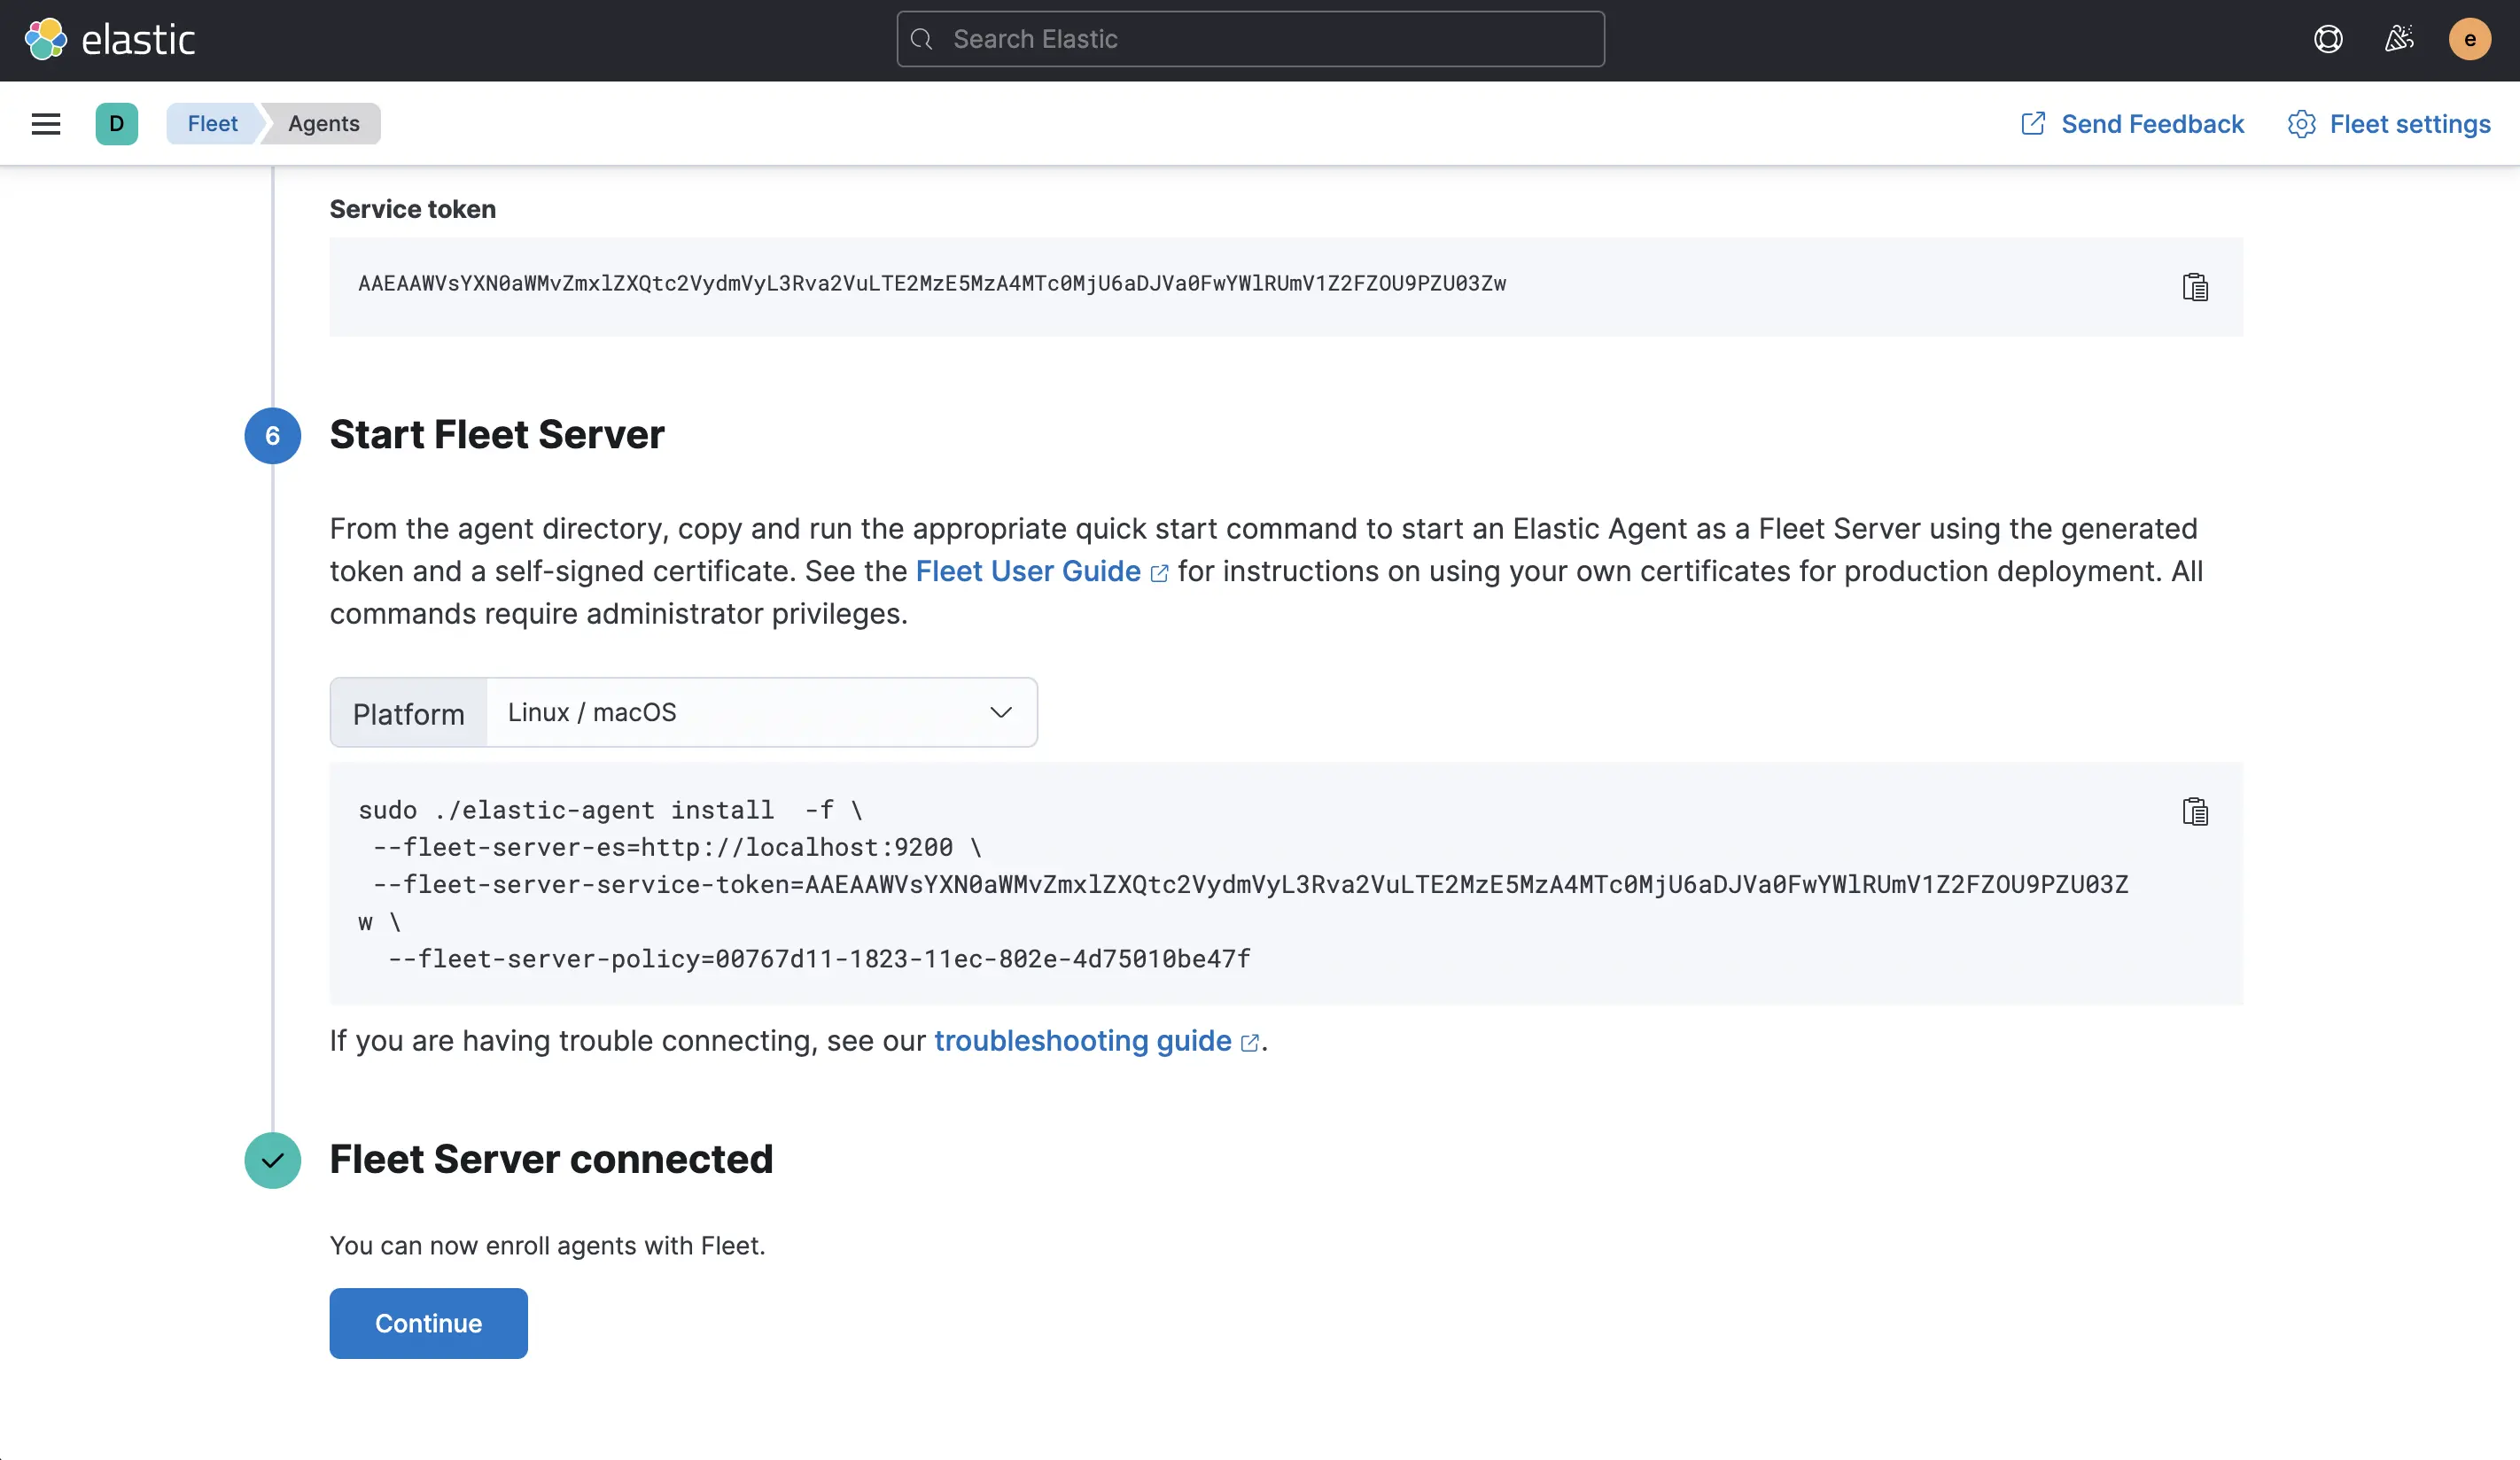
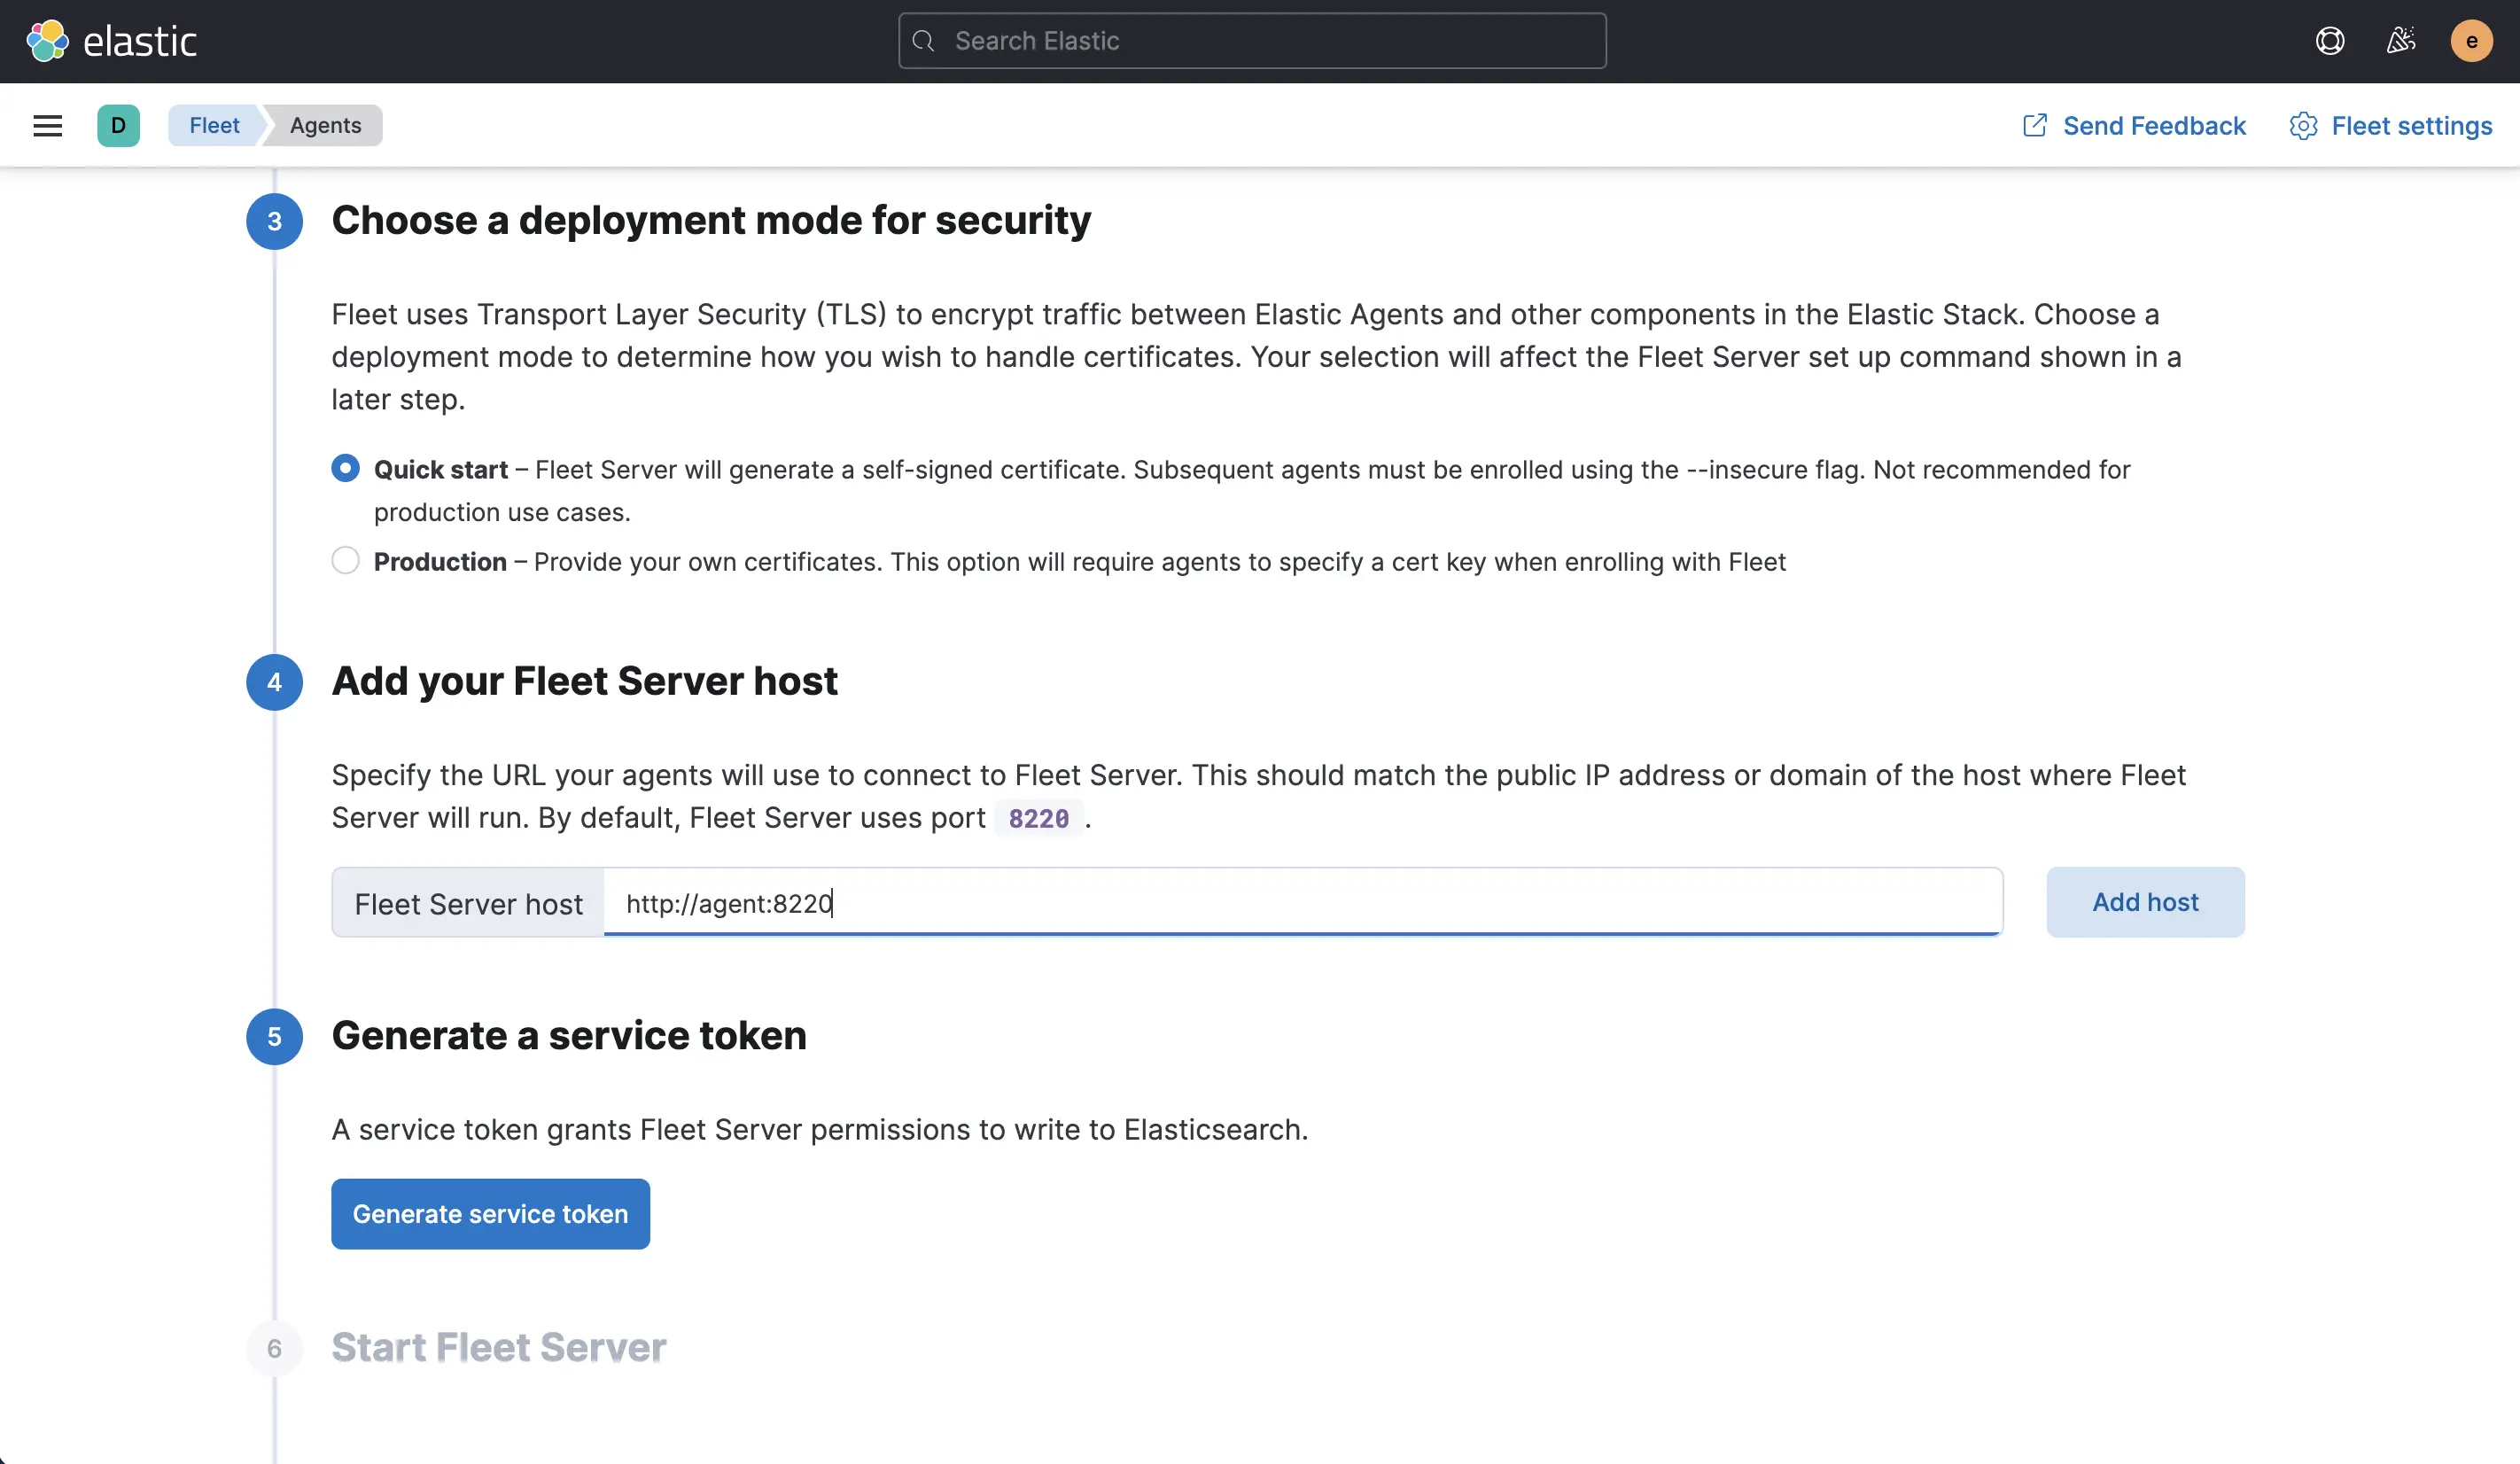 First, head to the Fleet page in Kibana. You can skip points 1 and 2. For point 3, pick the “Quick start” for the security mode. In point 4, set the fleet server to
 http://agent:8220, which will be the container --name in one of the following steps plus the default port for Fleet. Then generate the service token in point 5 and copy it.
Now you can start the Agent container, which will also be the Fleet server (FLEET_SERVER_ENABLE=true). You need to use your own FLEET_SERVER_SERVICE_TOKEN here:
docker run --name agent \
  --net elastic \
  --env FLEET_SERVER_ENABLE=true \
  --env FLEET_SERVER_ELASTICSEARCH_HOST=http://elasticsearch:9200 \
  --env FLEET_SERVER_SERVICE_TOKEN='AAEAAWVsYXN0aWMvZmxlZXQtc2VydmVyL3Rva2VuLTE2MzE5MzA4MTc0MjU6aDJVa0FwYWlRUmV1Z2FZOU9PZU03Zw' \
  --user=root \
  --volume='/var/run/docker.sock:/var/run/docker.sock:ro' \
  docker.elastic.co/beats/elastic-agent:8.0.0-alpha2
The --user and --volume configuration are only necessary for the Docker metrics collection in one of the steps further down — Agent itself will run fine without them.
 Once the Agent has started up and made contact with Elasticsearch, the page will update automatically.
 And the Agent will already be shown as enrolled on the next page, shown in the screenshot. While this page looks simple, the following three screenshots are all reached from here.
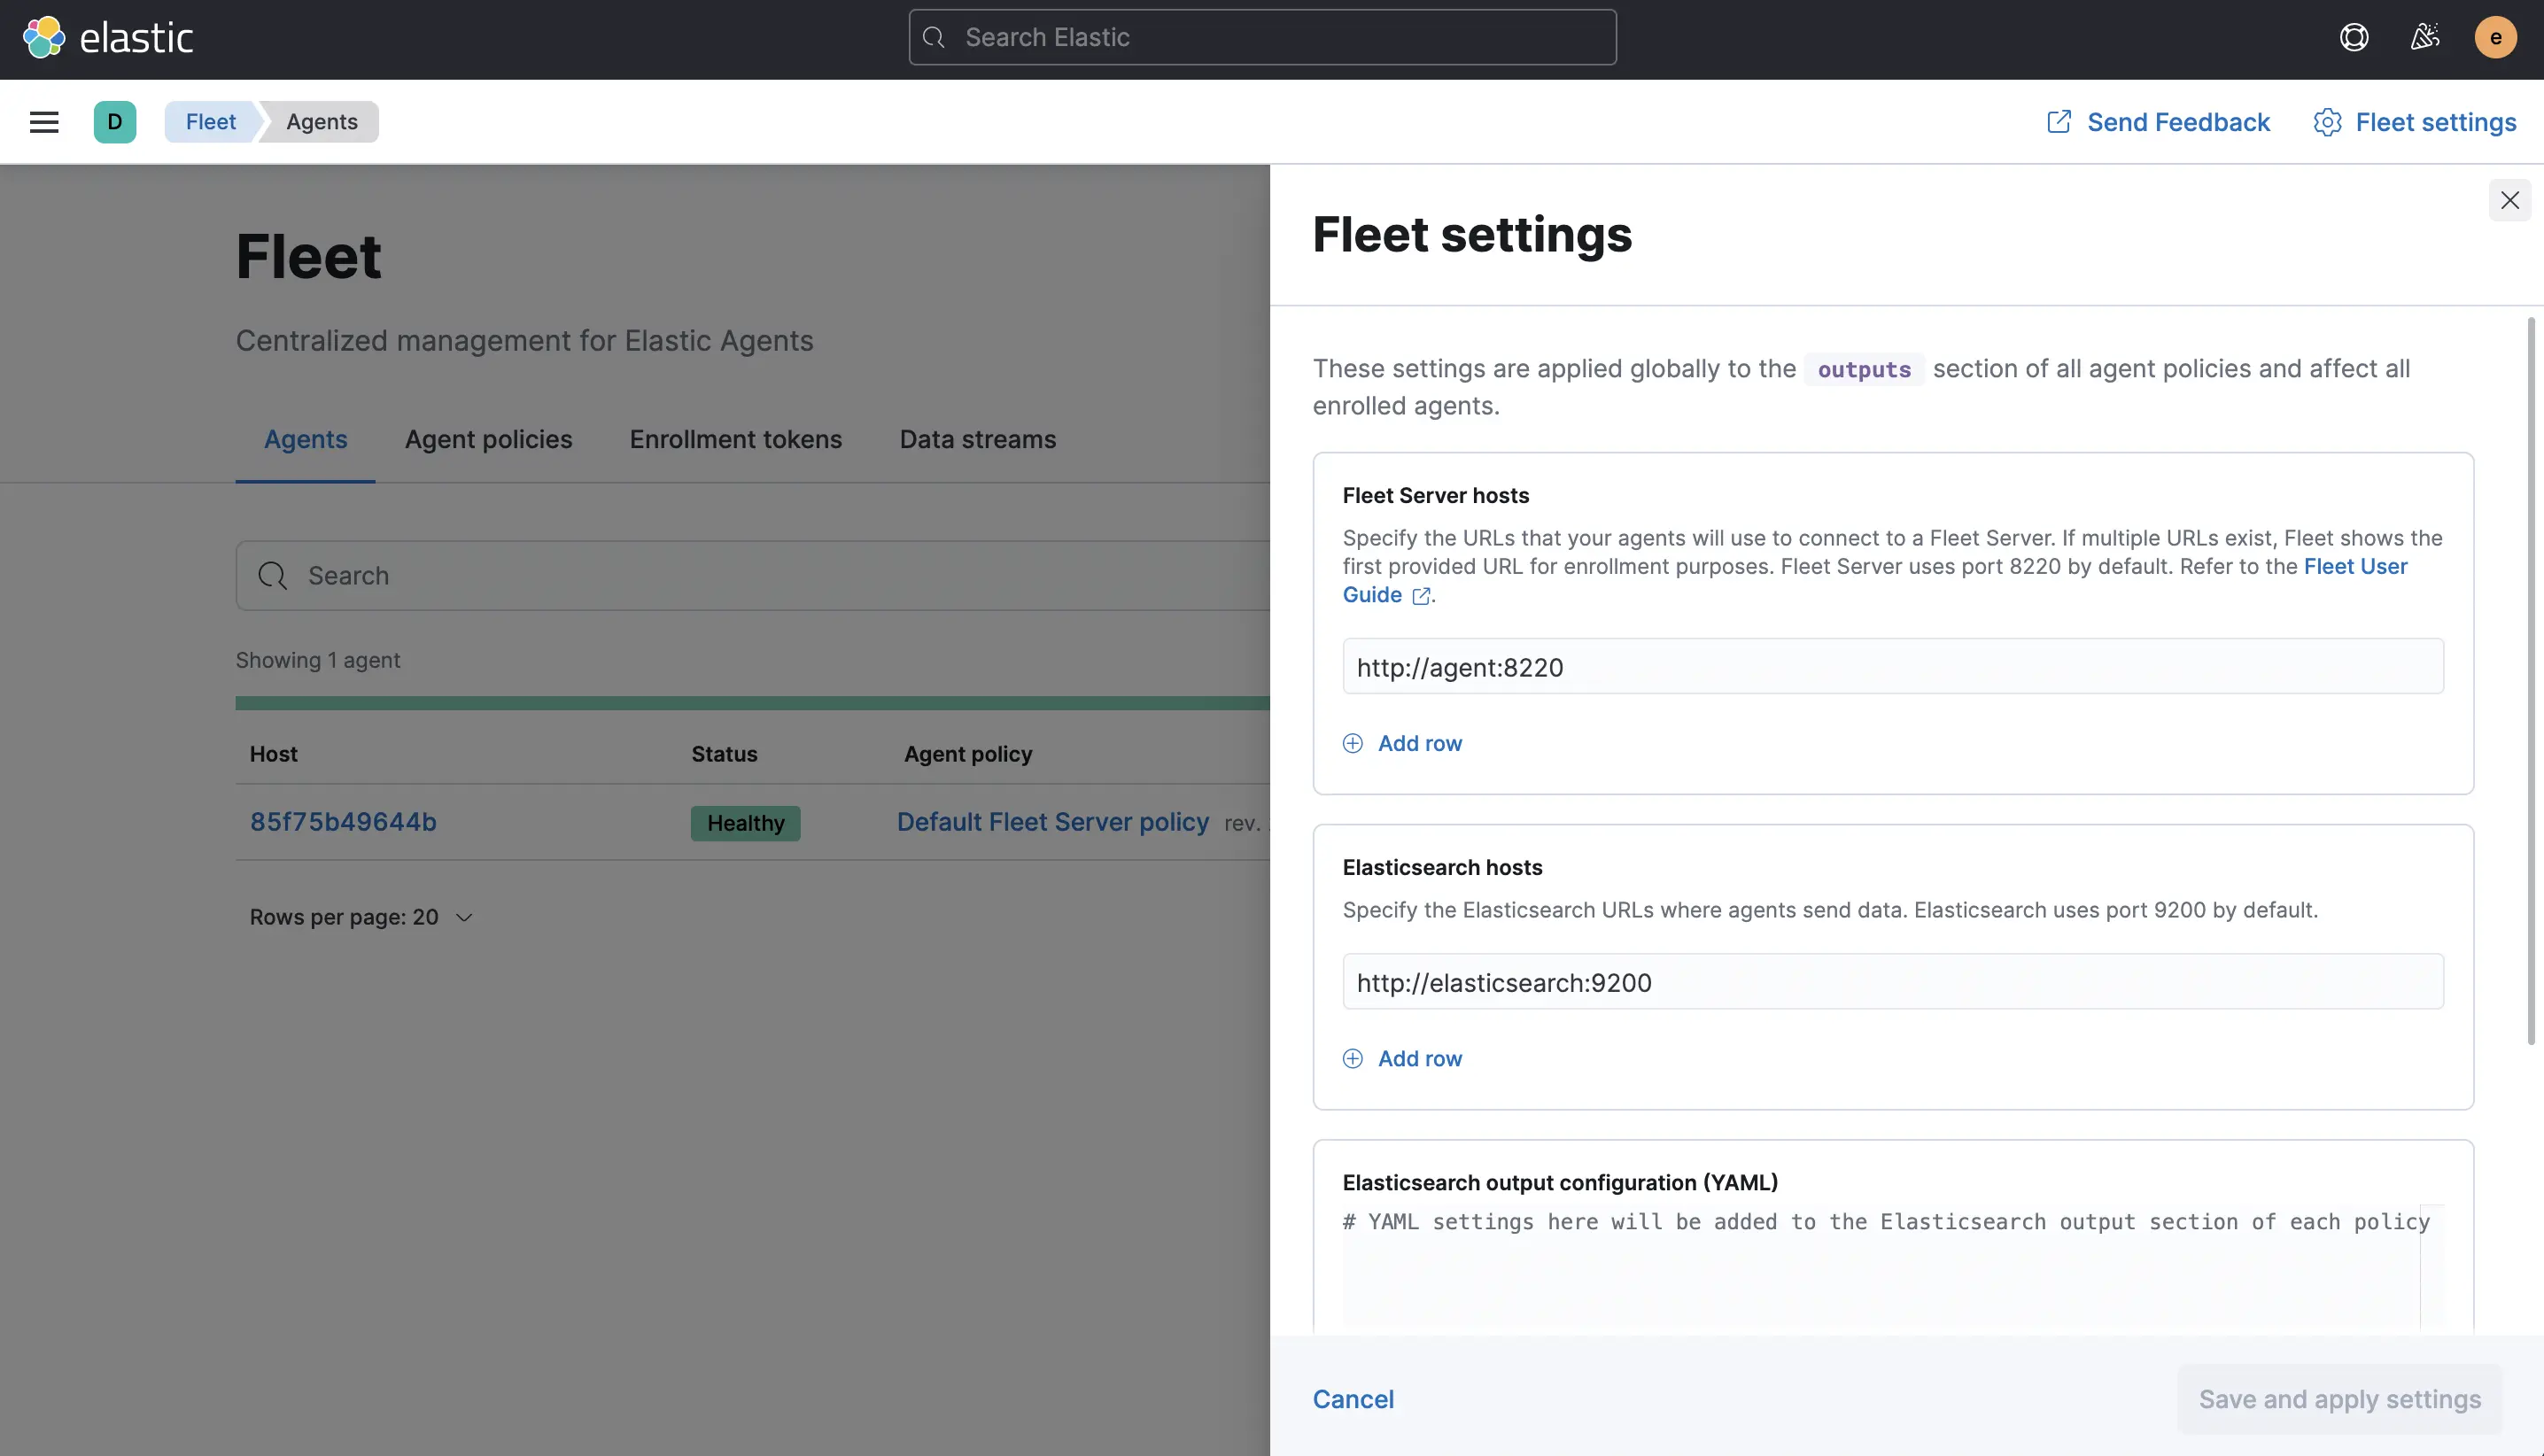 Important: Check the “Fleet settings” (top right corner) and ensure that the Fleet server host is
 http://agent:8220 and the Elasticsearch host is http://elasticsearch:9200. For me, these were misconfigured, and this will prevent any data collection from happening.
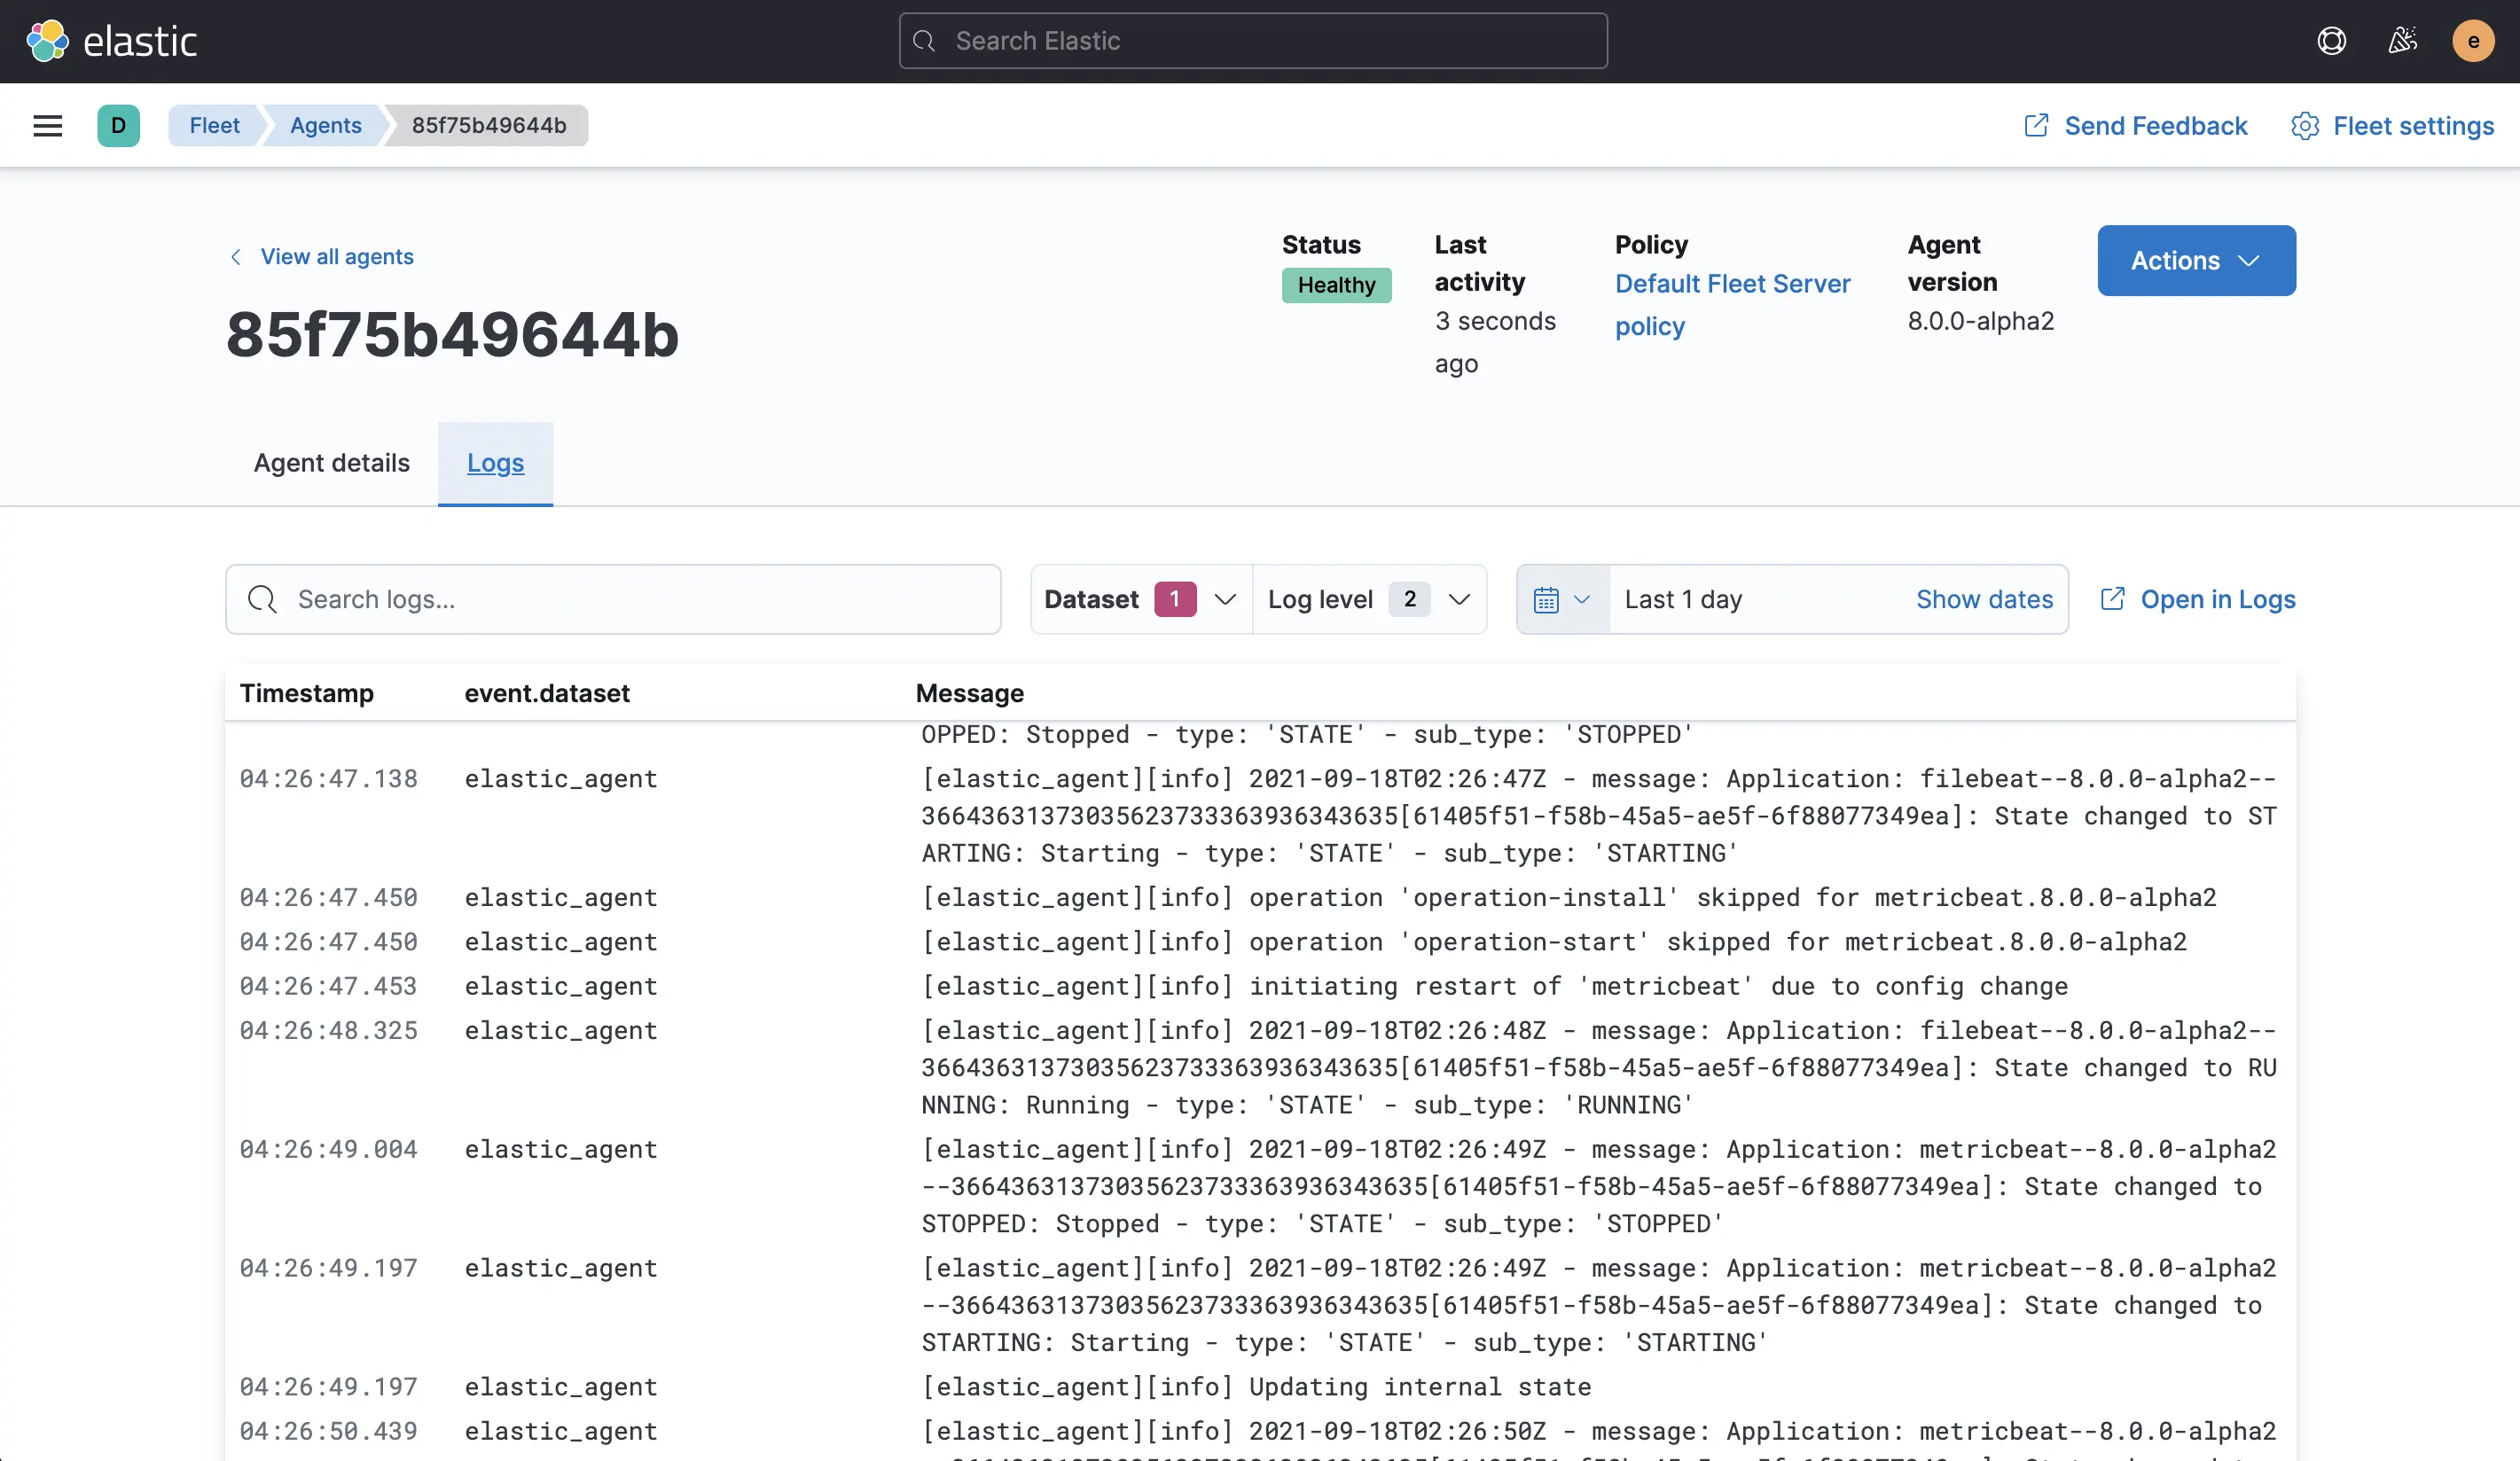 To check that this is working correctly, click on the “Host” —
 85f75b49644b in my screenshot — and check that you are receiving “Logs”. If you do, all is well. If you don’t, be sure to check the previous screenshot with the necessary configuration.
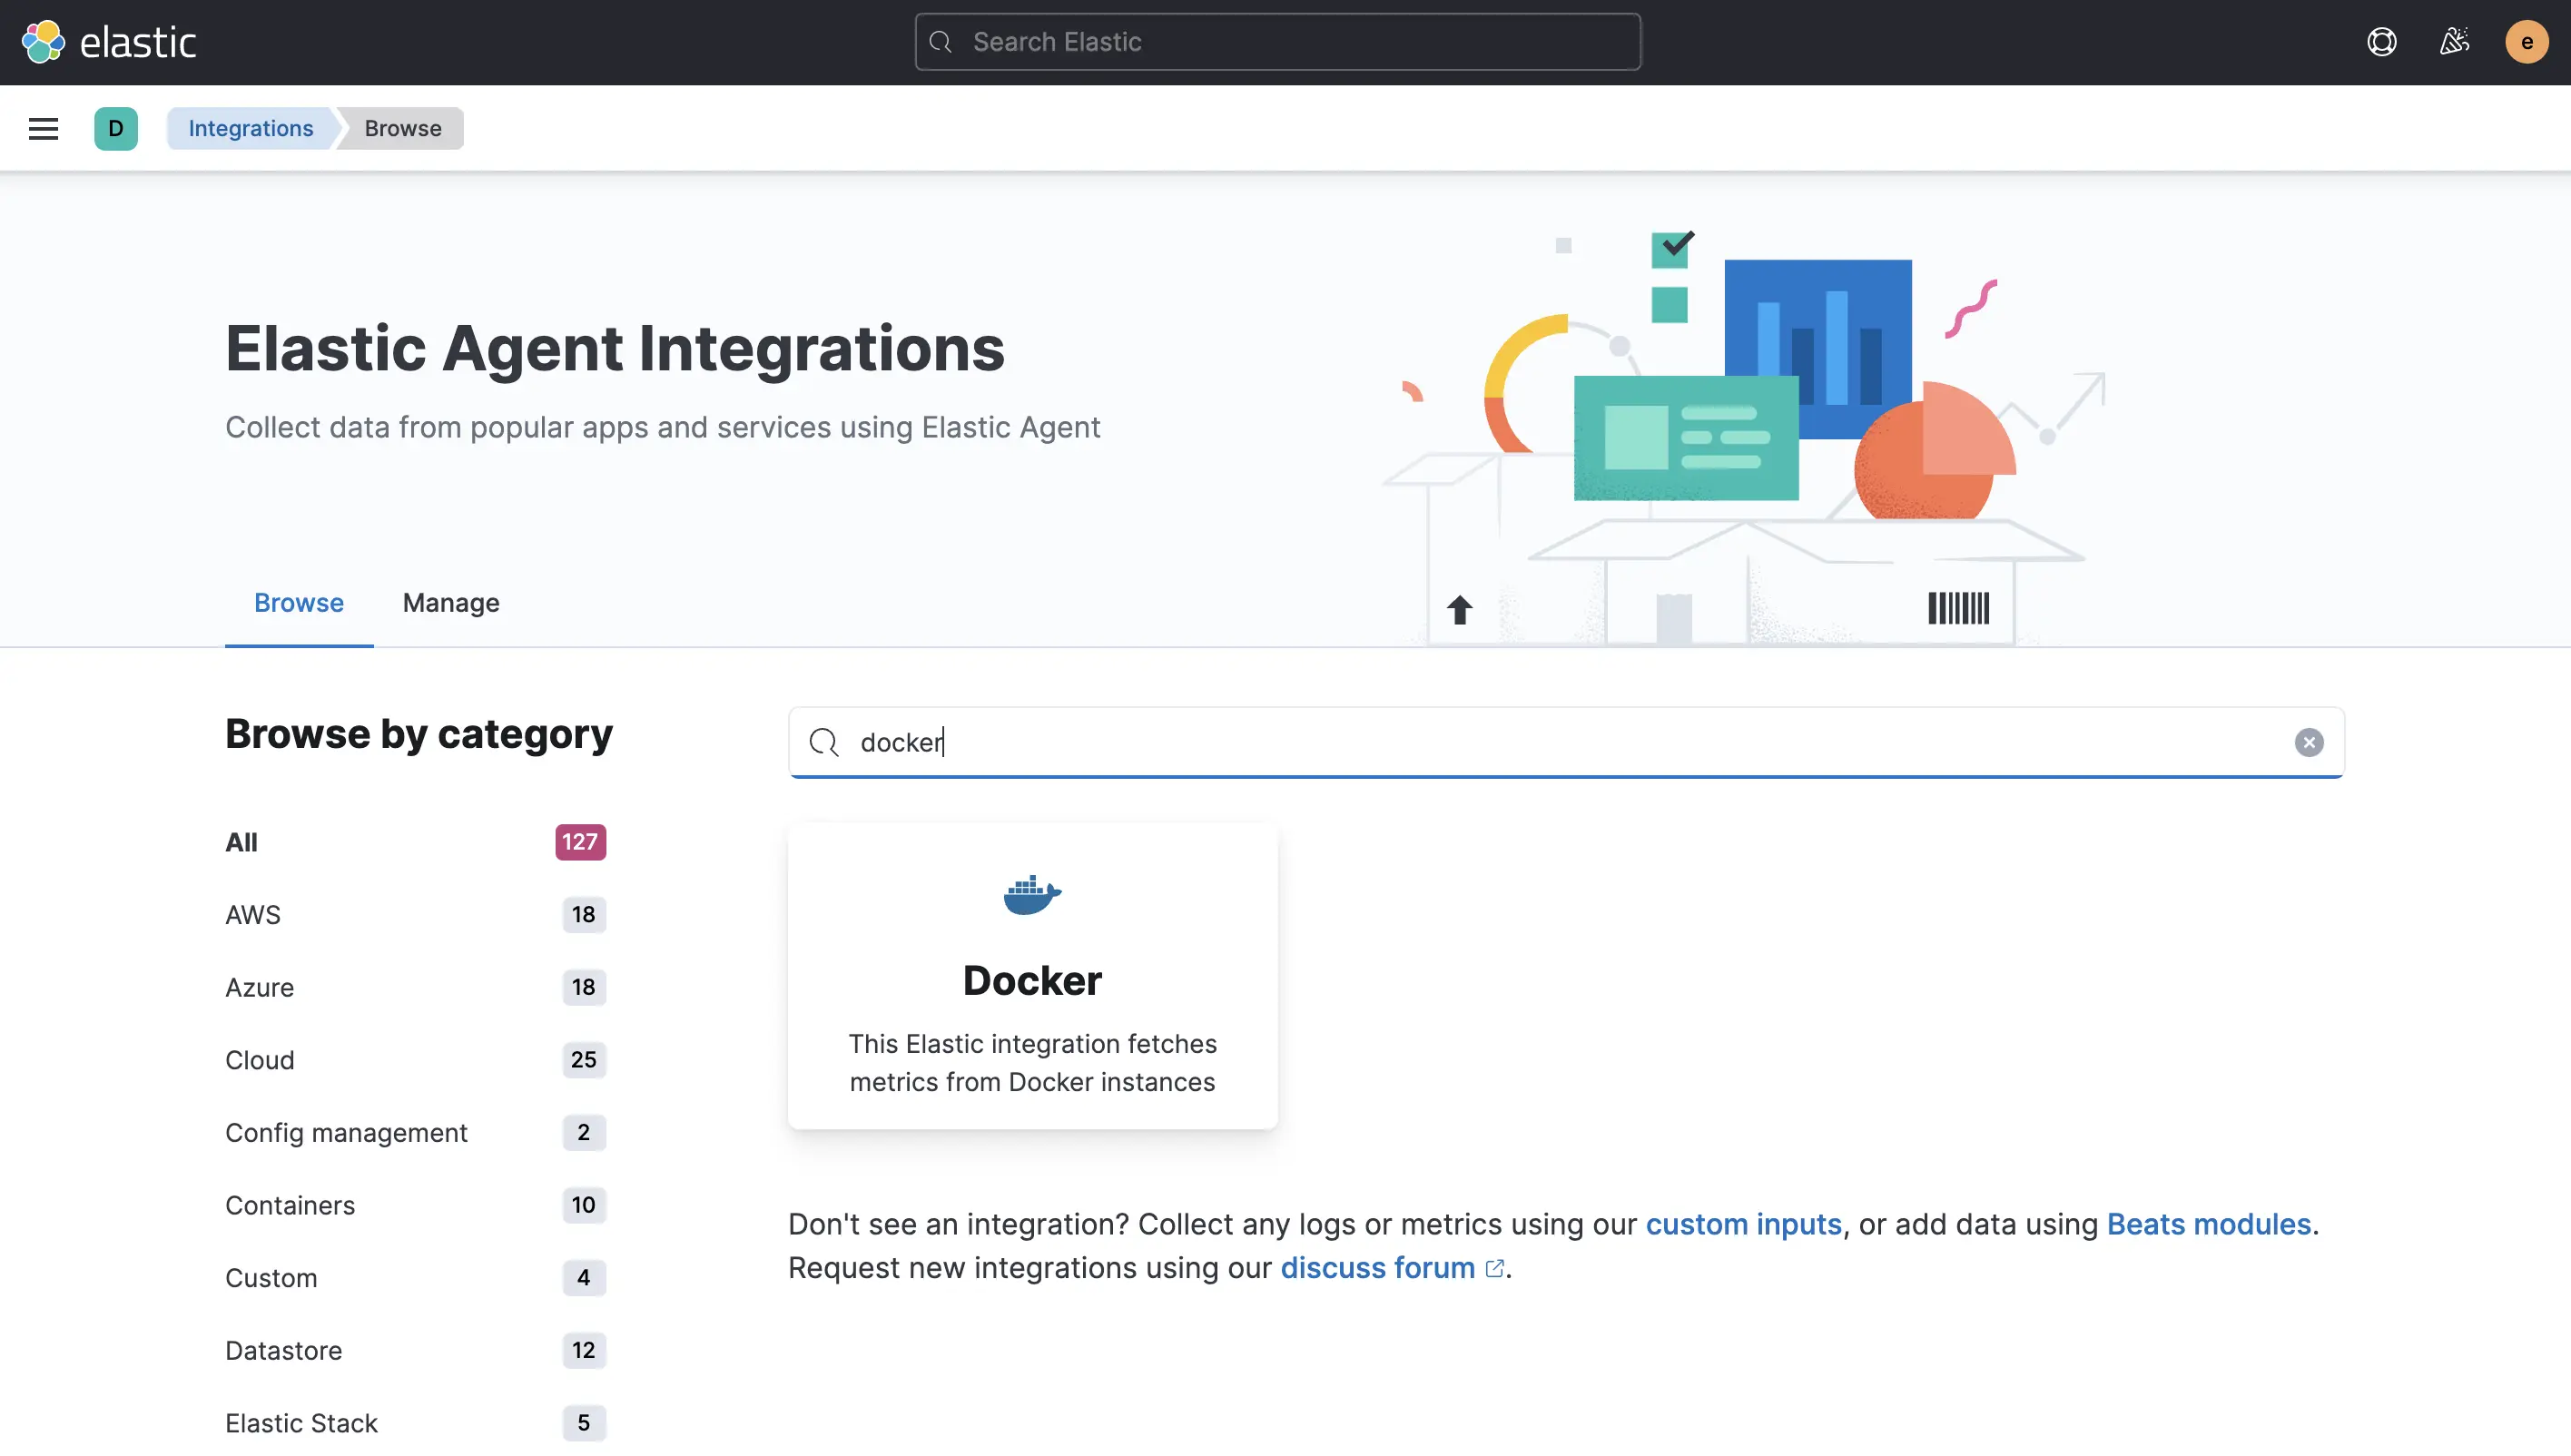 Final step: Extend the data collection through the UI. To do that, click on the “Agent policy”
 Default Fleet Server policy on the previous Agent overview page. On that page, “Add integration” and then search for docker.
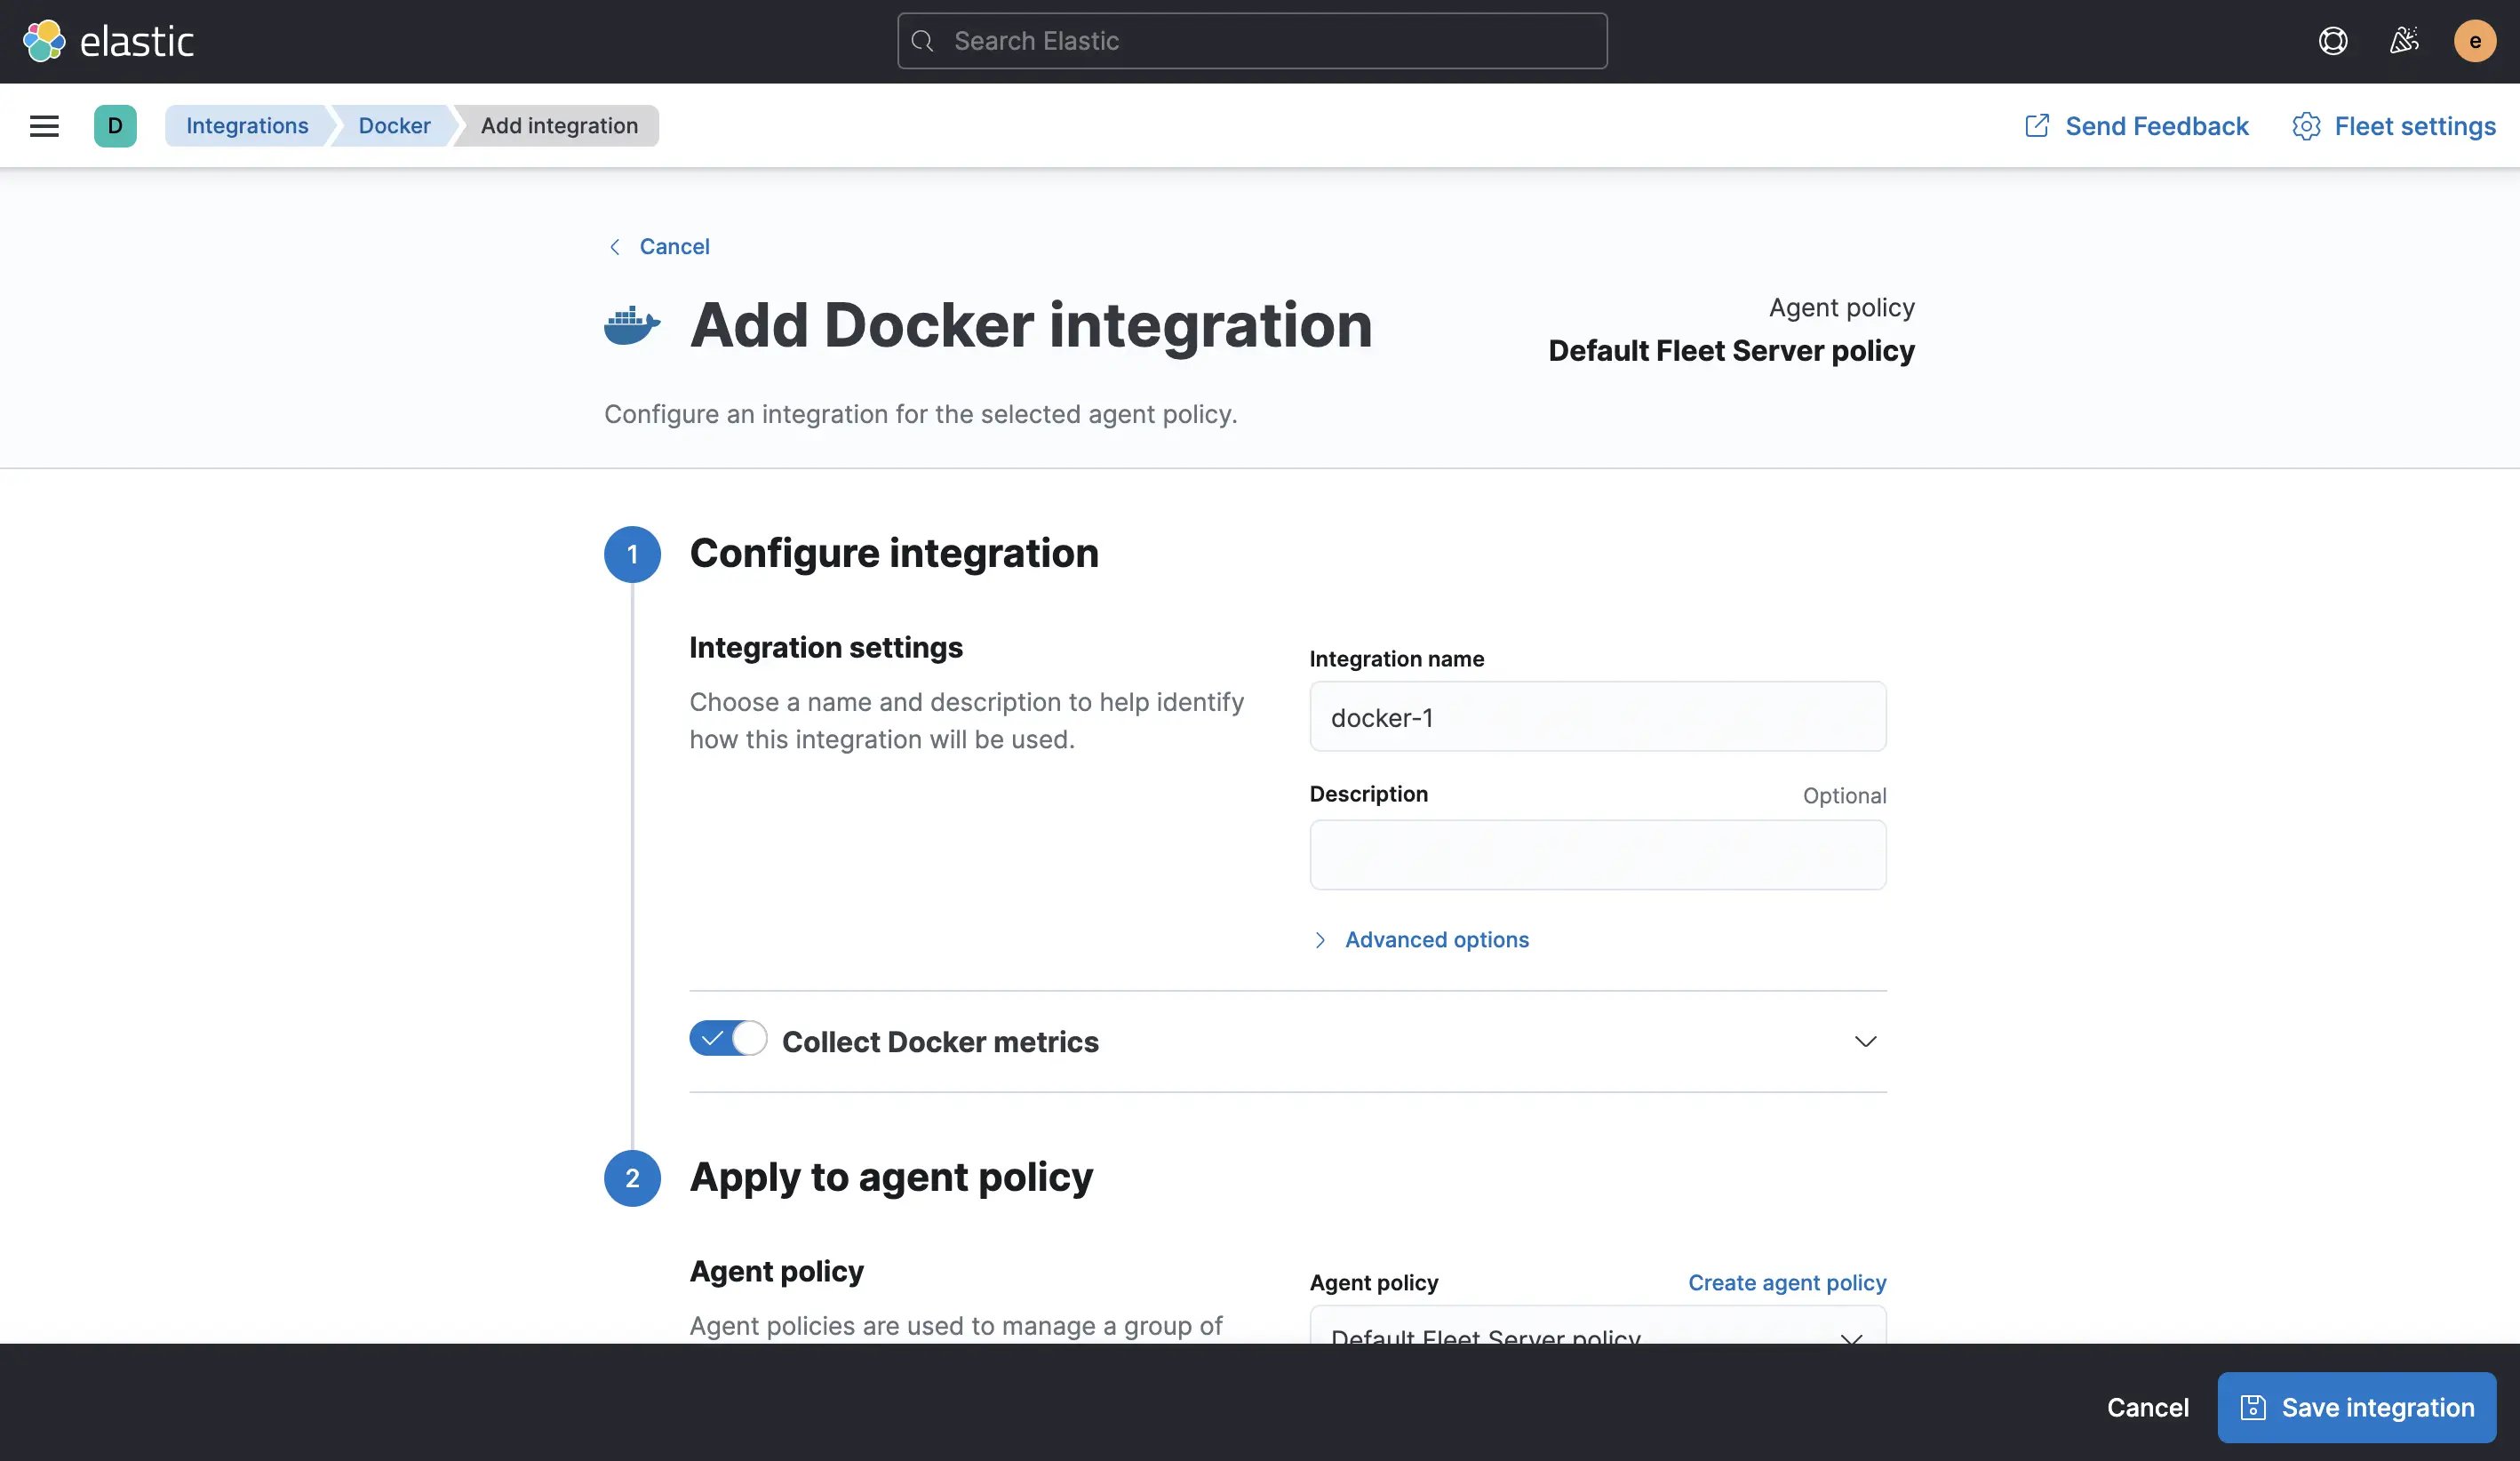 On the next page, “Add Docker” and “Save integration” with the default settings, which you then also need to “Save and deploy changes”.
 The Agent is up and running — let’s see some results. In Kibana, go to the “Dashboards” and open the “[Metrics Docker] Overview” one. This and many other dashboards are now only a click away — from data collection and preparation to visualization. And all of it on the 8.0.0-alpha2.
Once you are done testing, you can clean up with:
docker rm agent
docker rm kibana
docker rm elasticsearch
docker volume rm elasticsearch
docker network rm elastic
Video Overview #
For those who prefer a walkthrough in a video, here you go:
Conclusion #
 Getting 8.0.0-alpha2 up and running isn’t very different from a current 7.x versions — but that’s a feature and not a 🪳.
The visible features are also relatively close: Agent and Fleet are available there as well. Most of the changes are under the hood; like the security enablement by default (which is a breaking change and had to wait for a new major version) or the upcoming upgrade to Lucene 9. And while this doesn’t look like much, there are 580 pull requests between first and second alpha just in Elasticsearch alone. So please, help us test and get swag for any issues you report in the Elastic GitHub repositories for any 8.0.0 preview release.