
Slow Query Logging for Elasticsearch and Elastic Cloud
One of the recurring questions I’ve seen recently was:
How do you log slow queries in Elasticsearch and especially on Elastic Cloud?
The main challenge here is to connect the right dots to make this work.
Logging in Elasticsearch #
There are four ways to configure logging in Elasticsearch:
- On the command line, which is ideal for debugging a problem on a single node.
- In the
elasticsearch.ymlconfiguration file either when you’re debugging a service / daemon or for permanent settings. - In the
log4j2.propertiesconfiguration file, which is both powerful but also rather uncommon to use. - Through the Elasticsearch API, which can be changed dynamically. This is ideal when you don’t want to restart services — because it might change the behavior and when it would impact production. Generally, if you’re unsure, use this option, which also has the advantage of being applied to all nodes.
Also, the only option that’s available on Elastic Cloud and is the best fit for this use-case is through the API.
Slow Query Logging through the API #
The documentation has examples both for logging slow search (split into Query then Fetch) and index operations:
PUT my_index/_settings
{
    "index.search.slowlog.threshold.query.warn": "500ms",
    "index.search.slowlog.threshold.query.info": "250ms",
    "index.search.slowlog.threshold.fetch.warn": "200ms",
    "index.search.slowlog.threshold.fetch.info": "100ms",
    "index.indexing.slowlog.threshold.index.warn": "1s",
    "index.indexing.slowlog.threshold.index.info": "500ms",
    "index.search.slowlog.level": "info"
}
By default, the slowlog is disabled (-1), and you can use warn, info, debug, and trace to capture different thresholds. There are two additional tricks to collect more data:
- To log all queries, set the threshold to
0. - To log all indices, use
_allfor the index name. But beware that this would also collect queries from internal indices like.securityor.kibana. This will only be helpful in specific debugging scenarios.
Both options will potentially create a lot of logs, so use them sparingly and change them back when you don’t need them anymore.
Slow Query Logging on Elastic Cloud #
Using a cluster on Elastic Cloud this example logs all queries for the index my_index, which must already exist for setting the slowlog:
PUT my_index
PUT my_index/_settings
{
    "index.search.slowlog.threshold.query.warn": "0",
    "index.indexing.slowlog.threshold.index.warn": "0"
}
Creating two documents plus a search request retrieving one of them:
PUT my_index/_doc/1
{
  "name": "Philipp"
}
PUT my_index/_doc/2
{
  "name": "Alex"
}

GET my_index/_search
{
  "query": {
    "match": {
      "name": "philipp"
    }
  }
}
To see the log output you need to head to the Elastic Cloud admin UI and then <Cluster-Name> → Elasticsearch → Logs:
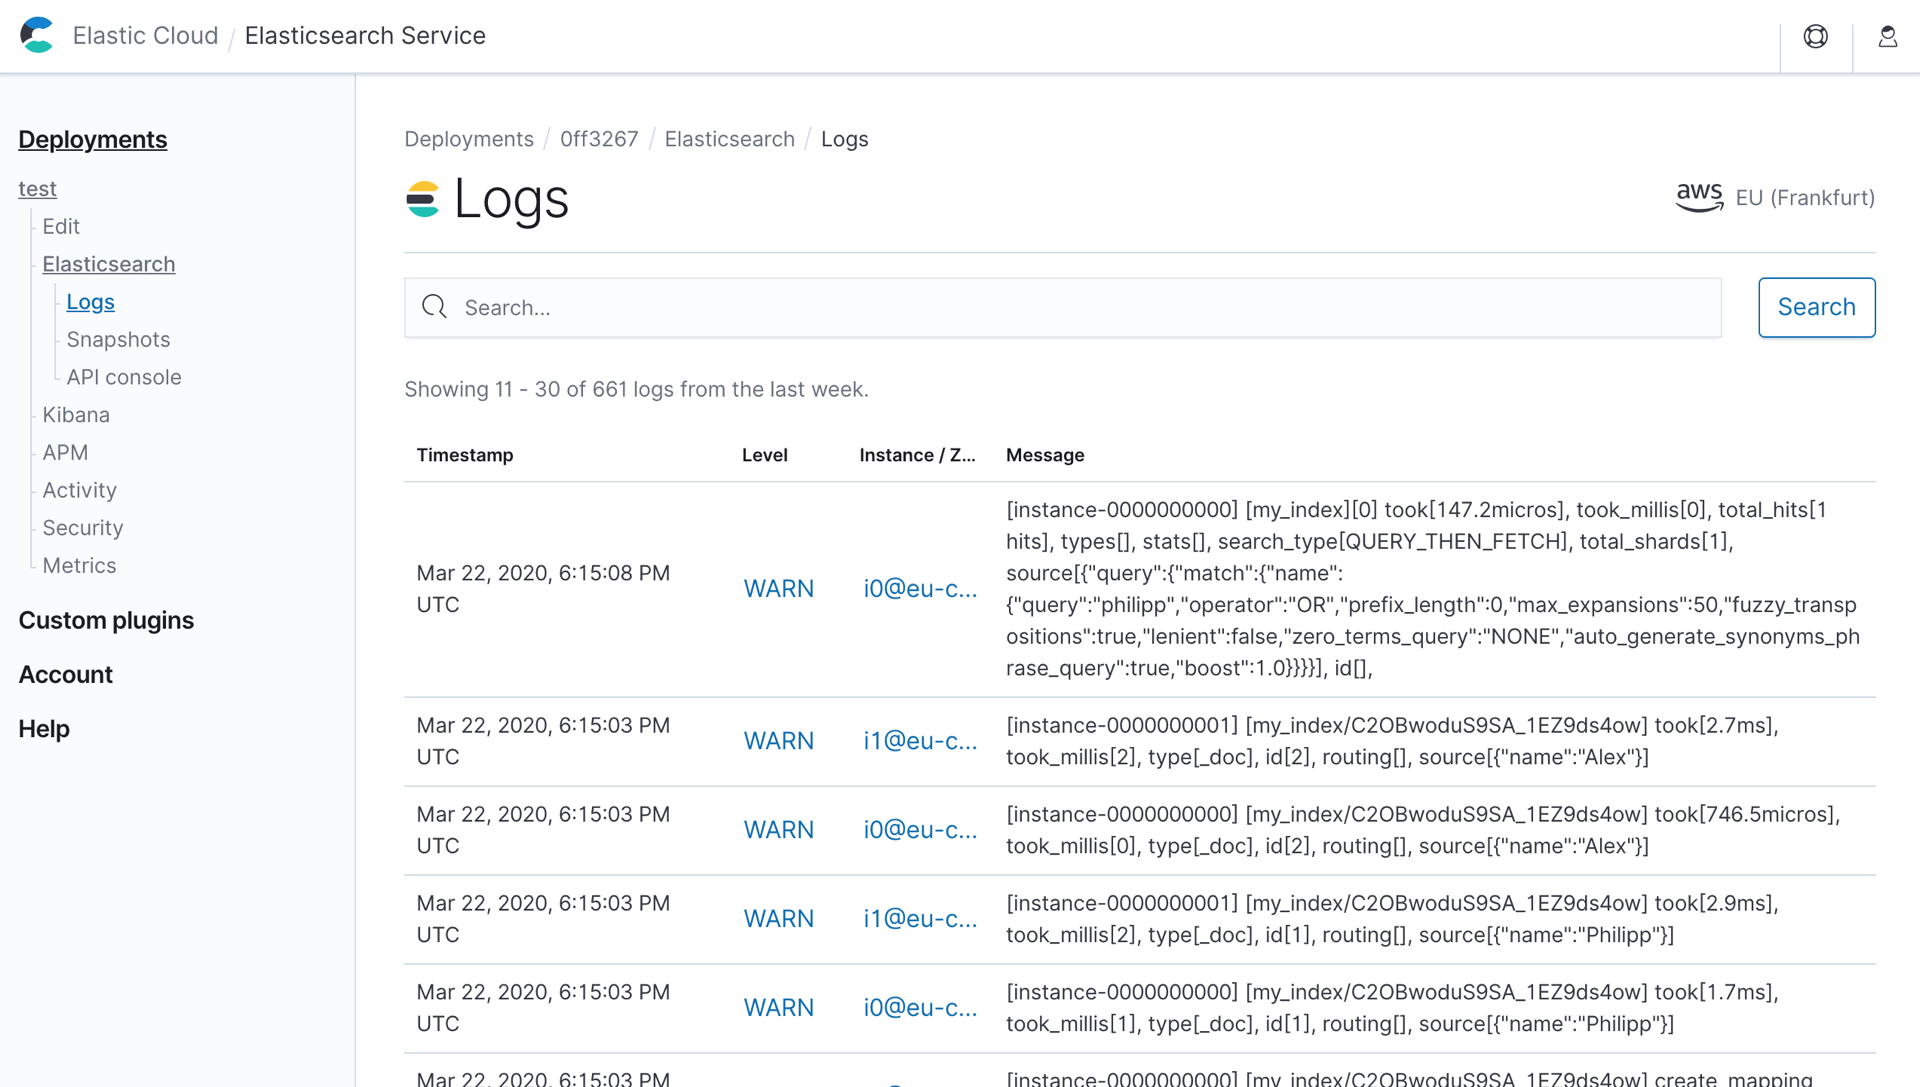
There you can find the indexing operation (per shard):
[instance-0000000000] [my_index/C2OBwoduS9SA_1EZ9ds4ow]
  took[746.5micros], took_millis[0], type[_doc], id[2], routing[],
  source[{"name":"Alex"}]
[instance-0000000001] [my_index/C2OBwoduS9SA_1EZ9ds4ow]
  took[2.7ms], took_millis[2], type[_doc], id[2], routing[],
  source[{"name":"Alex"}]
As well as the search operation — skipping the fetch phase:
[instance-0000000000] [my_index][0]
  took[147.2micros], took_millis[0],
  total_hits[1 hits], types[], stats[],
  search_type[QUERY_THEN_FETCH], total_shards[1],
  source[{
    "query": {
      "match": {
        "name": {
          "query": "philipp",
          "operator": "OR",
          "prefix_length": 0,
          "max_expansions": 50,
          "fuzzy_transpositions": true,
          "lenient": false,
          "zero_terms_query": "NONE",
          "auto_generate_synonyms_phrase_query": true,
          "boost": 1
        }
      }
    }
  }],
  id[],
This works, but admittedly the UI isn’t ideal, especially on a busy cluster. We’re working on a better solution.
Once you’re done you should reset the slowlog to its default values:
PUT my_index/_settings
{
    "index.search.slowlog.threshold.query.warn": null,
    "index.indexing.slowlog.threshold.index.warn": null
}
Conclusion #
Once you know which API to use and where to look for the logs, it’s quite simple to do. Happy hunting for slow queries!
PS: If you’re self-hosting Elasticsearch you can collect the slowlog with the Filebeat module for Elasticsearch and then treat them like any other logs in the Elastic Stack.