
Filebeat Modules with Docker & Kubernetes
While writing another blog post, I realized that using Filebeat modules with Docker or Kubernetes is less evident than it should be. Let me shed some light here. If you’re only interested in the final solution, jump to Plan D.
Filebeat and Filebeat Modules #
What is Filebeat?
Filebeat is a lightweight shipper for forwarding and centralizing log data. Installed as an agent on your servers, Filebeat monitors the log files or locations that you specify, collects log events, and forwards them […]
What are Filebeat modules?
Filebeat modules simplify the collection, parsing, and visualization of common log formats.
Currently, there are 70 modules for web servers, databases, cloud services,… and the list grows with every release. For example, the Elasticsearch module adds the features:
- Set the default paths based on the operating system to the log files of Elasticsearch.
- Collect multiline logs as a single event.
- Add an ingest pipeline to parse the various log files.
- It doesn’t (yet) have visualizations, dashboards, or Machine Learning jobs, but many other modules provide them out of the box.
All you need to do is to enable the module with filebeat modules enable elasticsearch. I’m sticking to the Elasticsearch module here since it can demo the scenario with just three components:
- Elasticsearch to generate the logs, but also to store them.
- Filebeat to collect the logs and forward them to Elasticsearch.
- Kibana to visualize the logs from Elasticsearch.

A minimal Filebeat configuration for this use-case would be:
filebeat.modules:
  - module: elasticsearch

output.elasticsearch:
  hosts: ["http://localhost:9200"]

setup.kibana:
  host: "http://localhost:5601"
This configuration would automatically collect the different log files from /var/log/elasticsearch/ (on Linux). Since 7.0 JSON log files are the new default and map to:
server:*_server.jsongc:gc.logandgc.log.[0-9]*audit:*_audit.jsonslowlog:*_index_search_slowlog.jsonand*_index_indexing_slowlog.jsondeprecation:*_deprecation.json
Here is a quick demo with the .tar.gz binaries, which are already downloaded and extracted. First, starting Elasticsearch and Kibana:
$ ls
elasticsearch/  filebeat/  kibana/
$ ./elasticsearch/bin/elasticsearch
...
$ ./kibana/bin/kibana
...
Some sample log lines from elasticsearch/logs/elasticsearch_server.json (@timestamp, cluster.name, and node.name fields removed for brevity):
{"type": "server", "level": "INFO", "component": "o.e.c.m.MetaDataMappingService", "message": "[.kibana_1/GQJ7d9pGQ_qZs36hSydGAA] update_mapping [_doc]", "cluster.uuid": "Out1VK3sSJeY-KmxhG5uvg", "node.id": "I-rG31vYQR-Ov07XB6mW-g"  }
{"type": "server", "level": "INFO", "component": "o.e.c.m.MetaDataCreateIndexService", "message": "[test] creating index, cause [api], templates [], shards [1]/[1], mappings []", "cluster.uuid": "Out1VK3sSJeY-KmxhG5uvg", "node.id": "I-rG31vYQR-Ov07XB6mW-g"  }
{"type": "server", "level": "INFO", "component": "o.e.x.i.IndexLifecycleTransition", "message": "moving index [filebeat-7.16.2-2020.04.26-000001] from [{\"phase\":\"hot\",\"action\":\"unfollow\",\"name\":\"wait-for-follow-shard-tasks\"}] to [{\"phase\":\"hot\",\"action\":\"unfollow\",\"name\":\"pause-follower-index\"}] in policy [filebeat]", "cluster.uuid": "Out1VK3sSJeY-KmxhG5uvg", "node.id": "I-rG31vYQR-Ov07XB6mW-g"  }
Before starting Filebeat, you need to edit filebeat/filebeat.yml to enable the Elasticsearch module and change to the custom paths of the log files. Also, connect to Elasticsearch to forward the data and Kibana for the setup:
filebeat.modules:
  - module: elasticsearch
    server:
      var.paths:
        - "../elasticsearch/logs/*_server.json"
    gc:
      var.paths:
        - "../elasticsearch/logs/gc.log.[0-9]*"
        - "../elasticsearch/logs/gc.log"
    slowlog:
      var.paths:
        - "../elasticsearch/logs/*_index_search_slowlog.json"
        - "../elasticsearch/logs/*_index_indexing_slowlog.json"
    deprecation:
      var.paths:
        - "../elasticsearch/logs/*_deprecation.json"

output.elasticsearch:
  hosts: ["http://localhost:9200"]

setup.kibana:
  host: "http://localhost:5601"
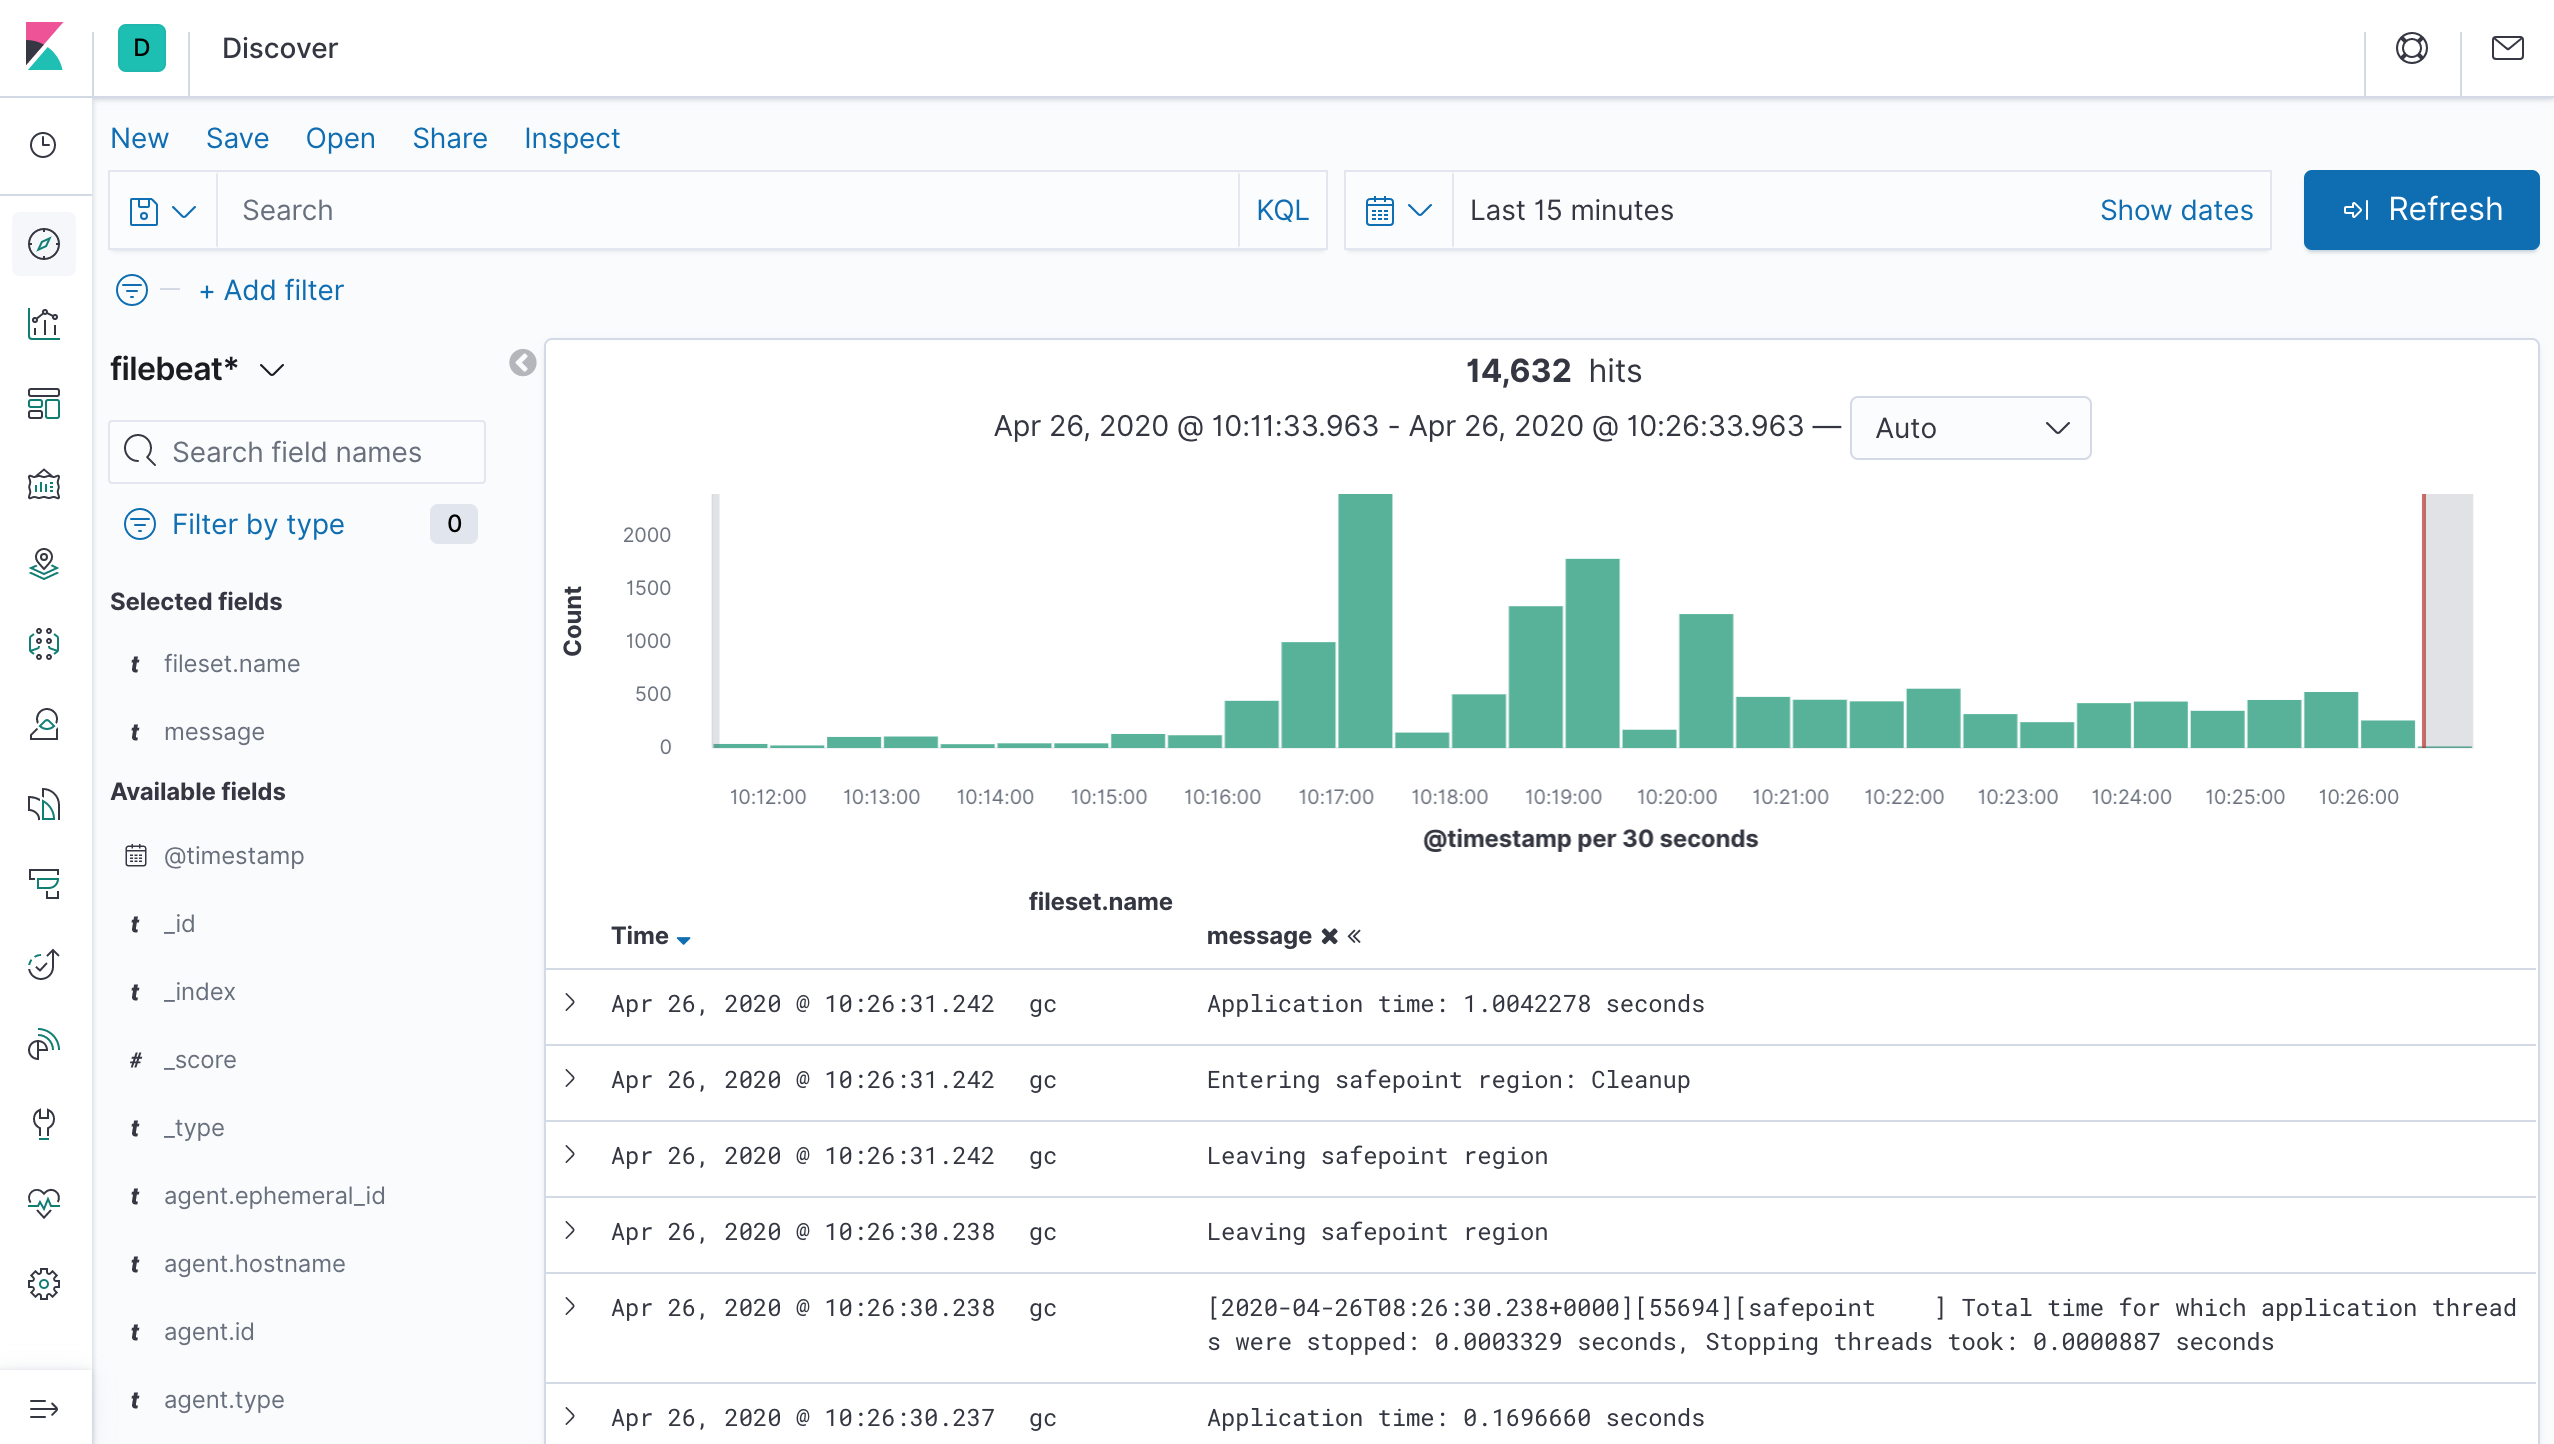
Now you can start Filebeat, and the output shows three sample log entries (there will be a lot more). Those are good indicators that the setup is working — harvesting the intended log files, adding the ingest pipelines, and connecting to Elasticsearch:
$ cd ./filebeat/
$ ./filebeat -e
...
INFO   Harvester started for file: /Users/philipp/Downloads/demo/elasticsearch/logs/elasticsearch_server.json
INFO   Elasticsearch pipeline with ID 'filebeat-7.16.2-elasticsearch-server-pipeline' loaded
INFO   Connection to backoff(elasticsearch(http://localhost:9200)) established
If everything works correctly, Discover in Kibana can show the collected events:
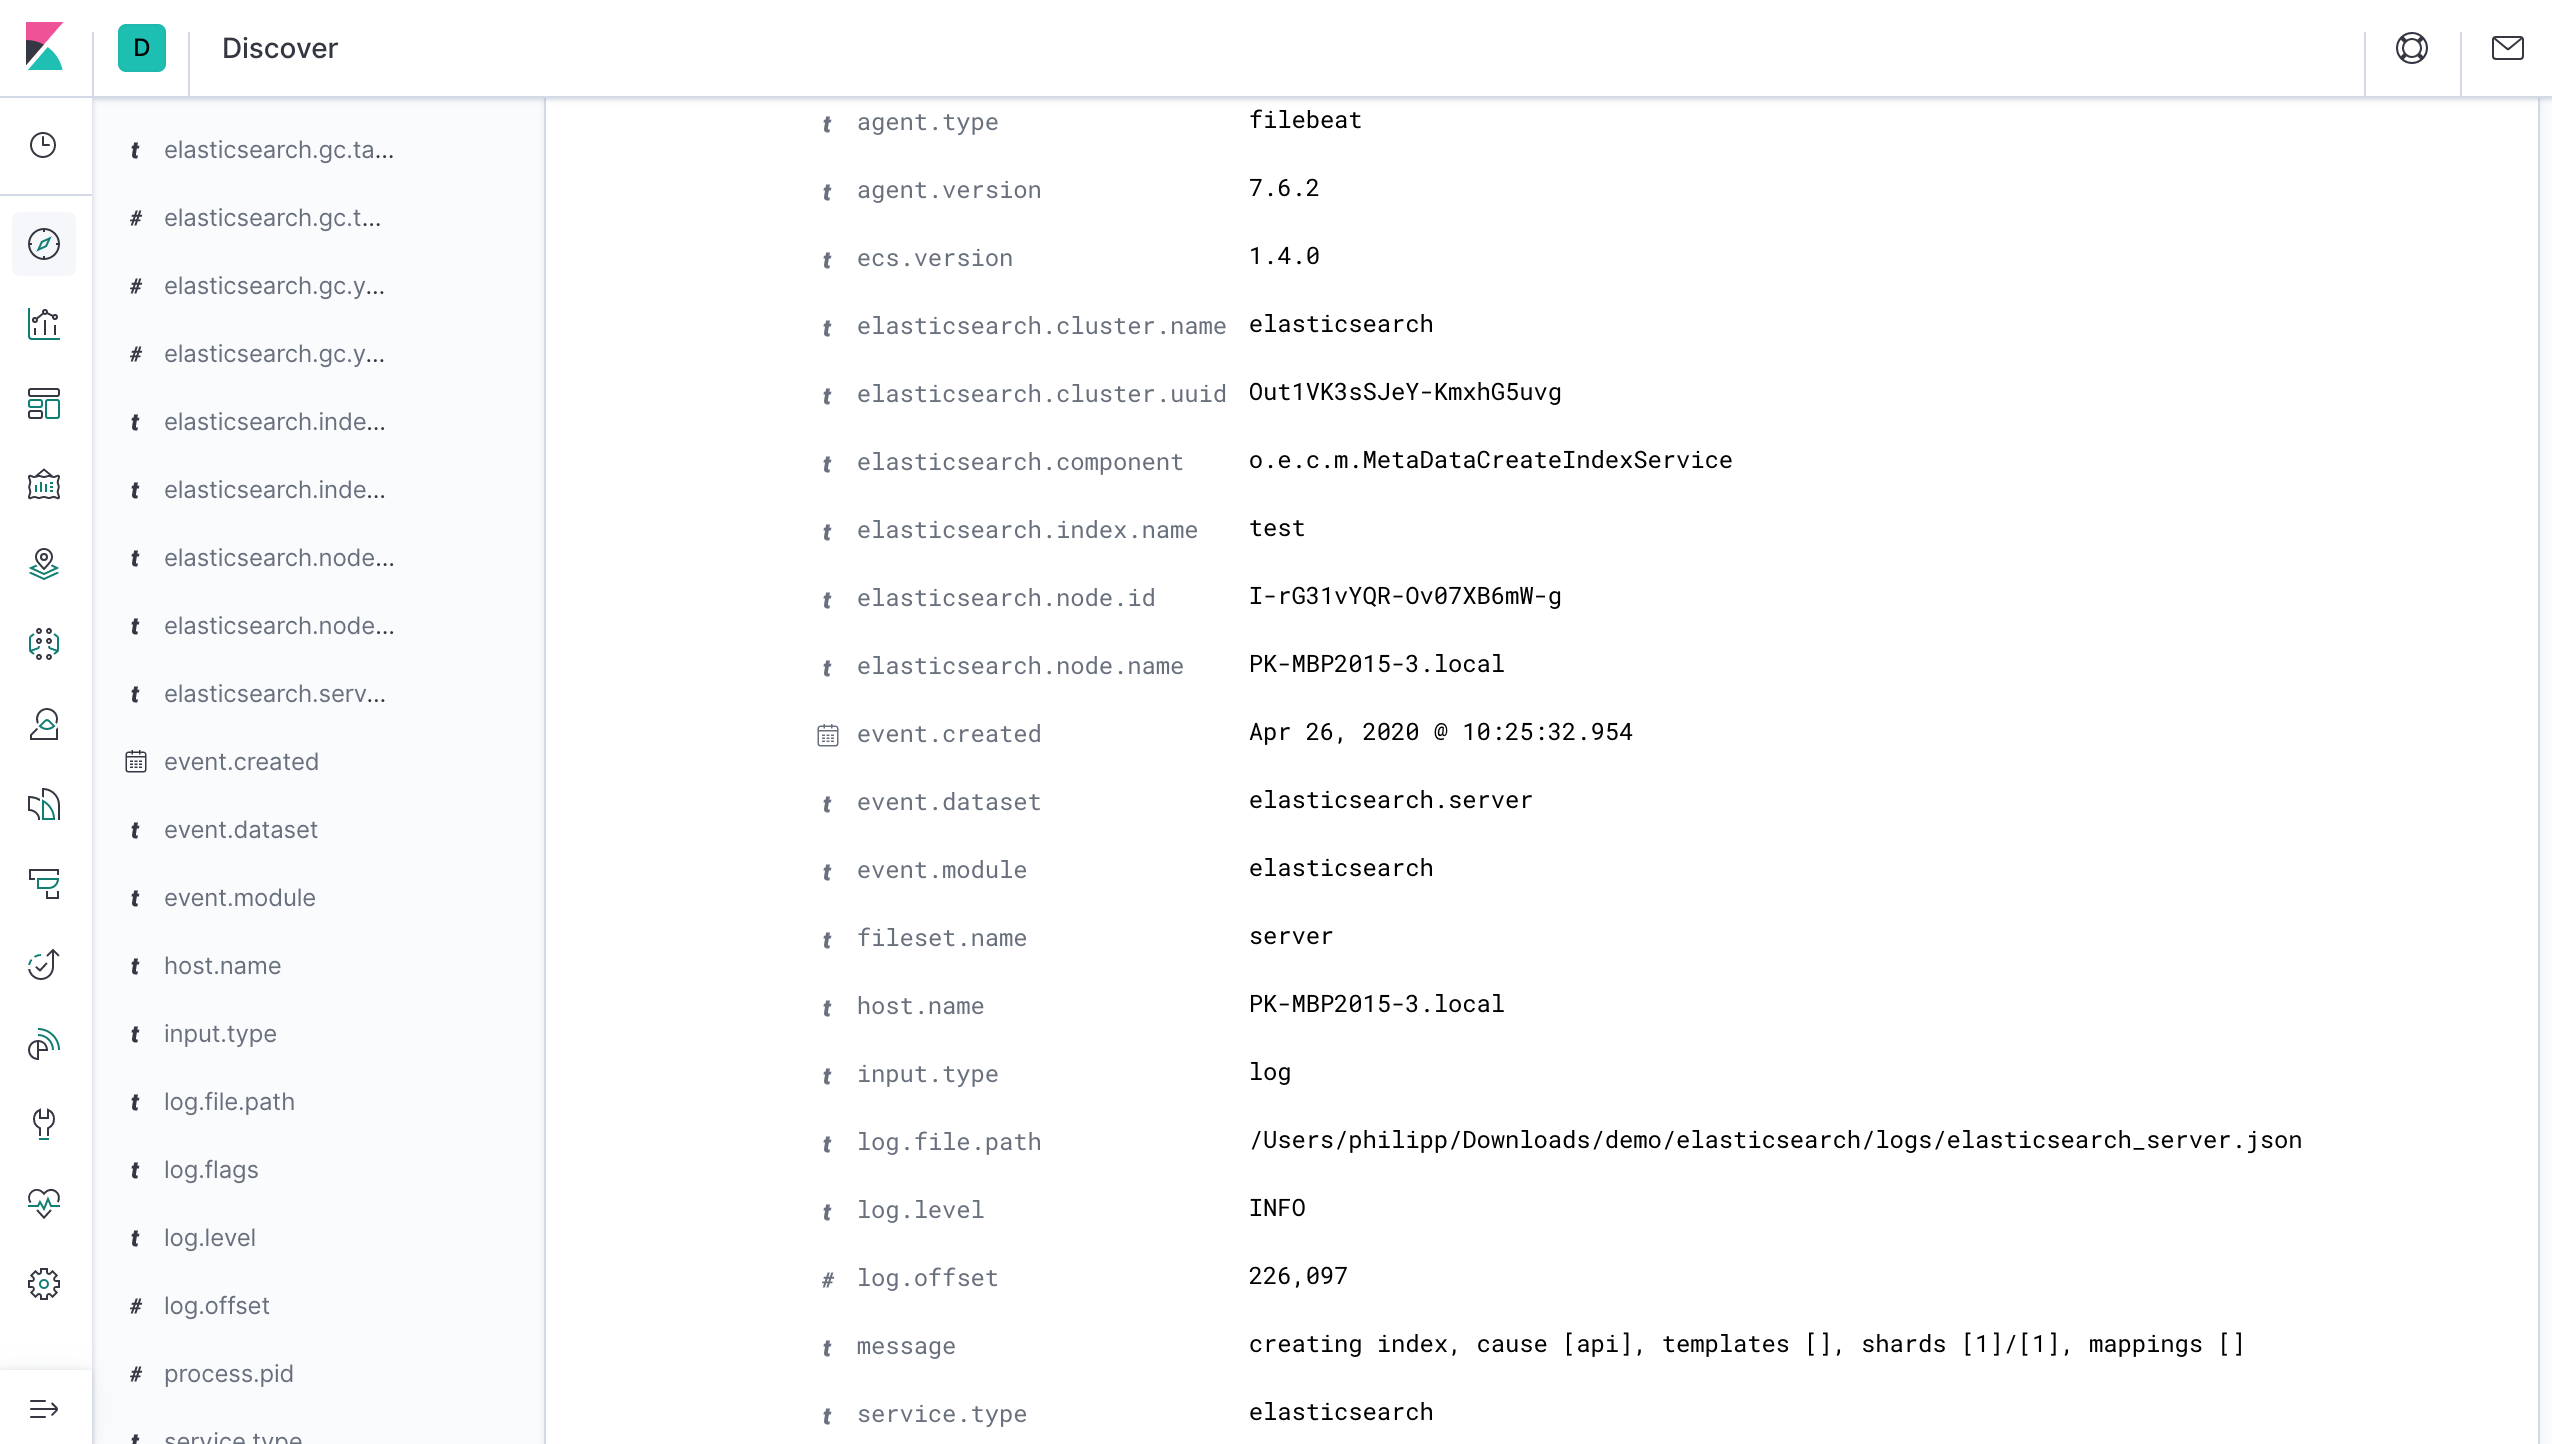
And the data is correctly structured so that you can easily filter on a specific node, index, or log level. The screenshot shows one of the three sample log lines from above:
Adding Docker and Kubernetes to the Mix #
What changes when you move this demo to containers? The location of log files. Quoting from the Elasticsearch Docker documentation:
Log messages go to the console and are handled by the configured Docker logging driver. By default you can access logs with
docker logs.
STDOUT and STDERR are the right approach for containers, but what does that mean for Filebeat modules? To keep it simple, I’m using Docker Compose for the demo.
Plan A: Mount Folders #
The default path of /var/log/elasticsearch/ won’t contain any logs. If your initial plan was to mount that folder from the Elasticsearch container to the host and then into the Filebeat container, that is not going to work.
Here is an example of docker logs from an Elasticsearch container for inspiration (@timestamp, cluster.name, and node.name fields removed for brevity):
{ "type": "server", "level": "INFO", "component": "o.e.c.m.MetaDataCreateIndexService", "message": "[filebeat-7.16.2-2020.04.26-000001] creating index, cause [api], templates [filebeat-7.16.2], shards [1]/[1], mappings [_doc]", "cluster.uuid": "F5afZGv0SW25LctEgkgwXA", "node.id": "U_Hv1fUgToCVZ2_OS964yA" }
{ "type": "server", "level": "INFO", "component": "o.e.c.m.MetaDataIndexTemplateService", "message": "adding template [.management-beats] for index patterns [.management-beats]", "cluster.uuid": "F5afZGv0SW25LctEgkgwXA", "node.id": "U_Hv1fUgToCVZ2_OS964yA" }
{ "type": "server", "level": "INFO", "component": "o.e.c.m.MetaDataMappingService", "message": "[.kibana_1/BE7x8ad1SxiToIKvC5rHOQ] update_mapping [_doc]", "cluster.uuid": "F5afZGv0SW25LctEgkgwXA", "node.id": "U_Hv1fUgToCVZ2_OS964yA" }
The Docker logs are stored in /var/lib/docker/containers/. Though on macOS there is a VM layer in-between, so it can run on a Linux Kernel. There you need to run the following commands to access the logs of the container <ID> (replace with the actual ID):
$ screen ~/Library/Containers/com.docker.docker/Data/com.docker.driver.amd64-linux/tty
$ tail -n 3 /var/lib/docker/containers/<ID>/<ID>-json.log
{"log":"{\"type\": \"server\", \"timestamp\": \"2020-04-26T10:01:09,384Z\", \"level\": \"INFO\", \"component\": \"o.e.x.i.IndexLifecycleTransition\", \"cluster.name\": \"docker-cluster\", \"node.name\": \"elasticsearch\", \"message\": \"moving index [ilm-history-1-000001] from [{\\\"phase\\\":\\\"hot\\\",\\\"action\\\":\\\"unfollow\\\",\\\"name\\\":\\\"open-follower-index\\\"}] to [{\\\"phase\\\":\\\"hot\\\",\\\"action\\\":\\\"unfollow\\\",\\\"name\\\":\\\"wait-for-yellow-step\\\"}] in policy [ilm-history-ilm-policy]\", \"cluster.uuid\": \"F5afZGv0SW25LctEgkgwXA\", \"node.id\": \"U_Hv1fUgToCVZ2_OS964yA\"}\n","stream":"stdout","time":"2020-04-26T10:01:09.385191Z"}
{"log":"{\"type\": \"server\", \"timestamp\": \"2020-04-26T10:01:09,531Z\", \"level\": \"INFO\", \"component\": \"o.e.x.i.IndexLifecycleTransition\", \"cluster.name\": \"docker-cluster\", \"node.name\": \"elasticsearch\", \"message\": \"moving index [filebeat-7.16.2-2020.04.26-000001] from [{\\\"phase\\\":\\\"hot\\\",\\\"action\\\":\\\"unfollow\\\",\\\"name\\\":\\\"wait-for-yellow-step\\\"}] to [{\\\"phase\\\":\\\"hot\\\",\\\"action\\\":\\\"rollover\\\",\\\"name\\\":\\\"check-rollover-ready\\\"}] in policy [filebeat]\", \"cluster.uuid\": \"F5afZGv0SW25LctEgkgwXA\", \"node.id\": \"U_Hv1fUgToCVZ2_OS964yA\"}\n","stream":"stdout","time":"2020-04-26T10:01:09.5325047Z"}
{"log":"{\"type\": \"server\", \"timestamp\": \"2020-04-26T10:01:09,697Z\", \"level\": \"INFO\", \"component\": \"o.e.x.i.IndexLifecycleTransition\", \"cluster.name\": \"docker-cluster\", \"node.name\": \"elasticsearch\", \"message\": \"moving index [ilm-history-1-000001] from [{\\\"phase\\\":\\\"hot\\\",\\\"action\\\":\\\"unfollow\\\",\\\"name\\\":\\\"wait-for-yellow-step\\\"}] to [{\\\"phase\\\":\\\"hot\\\",\\\"action\\\":\\\"rollover\\\",\\\"name\\\":\\\"check-rollover-ready\\\"}] in policy [ilm-history-ilm-policy]\", \"cluster.uuid\": \"F5afZGv0SW25LctEgkgwXA\", \"node.id\": \"U_Hv1fUgToCVZ2_OS964yA\"}\n","stream":"stdout","time":"2020-04-26T10:01:09.6978308Z"}
To exit screen, press ctrl + a then k and y when asked for confirmation.
The log file looks promising. How could you use this data to get back to the result of the Filebeat module?
Plan B: Reuse the Ingest Pipelines #
Combine the Docker logs with some Filebeat features and tie the ingest pipeline into it. The idea is:
- Collect the logs with
containerinput. - Add the container metadata. With the
add_docker_metadataprocessor, each log event includes container ID, name, image, and labels from the Docker API. If you are using Kubernetes, you could enrich each log event withadd_kubernetes_metadataprocessor to get pod, namespace,… from the Kubernetes API. - On the Elasticsearch output, you can add ingest pipelines with conditions. So based on conditions from the metadata you could apply the different ingest pipelines from the Filebeat module.
Putting this into practice, the first step is to fetch the names of the ingest pipelines with GET _ingest/pipeline; for example, from the demo before adding Docker. The relevant ones are:
{
  "filebeat-7.16.2-elasticsearch-deprecation-pipeline" : { ... },
  "filebeat-7.16.2-elasticsearch-slowlog-pipeline" : { ... },
  "filebeat-7.16.2-elasticsearch-gc-pipeline" : { ... },
  "filebeat-7.16.2-elasticsearch-server-pipeline" : { ... },
  "filebeat-7.16.2-elasticsearch-audit-pipeline" : { ... }
}
Then the filebeat.yml configuration could look like the following:
filebeat.inputs:
- type: container
  paths:
    - "/var/lib/docker/containers/*/*.log"

filebeat.modules:
  - module: elasticsearch  1️⃣

processors:
  - add_docker_metadata: ~

output.elasticsearch:
  hosts: ["http://elasticsearch:9200"]
  pipelines:
    - pipeline: "filebeat-%{[agent.version]}-elasticsearch-server-pipeline"
      when:
        and:
          - equals:  2️⃣
              container.labels.org_label-schema_url: "https://www.elastic.co/products/elasticsearch"
          - contains:  3️⃣
              message: '"type": "server"'
    - pipeline: "filebeat-%{[agent.version]}-elasticsearch-deprecation-pipeline"
      when:
        and:
          - equals:
              container.labels.org_label-schema_url: "https://www.elastic.co/products/elasticsearch"
          - contains:
              message: '"type": "deprecation"'
    - pipeline: "filebeat-%{[agent.version]}-elasticsearch-audit-pipeline"
      when:
        and:
          - equals:
              container.labels.org_label-schema_url: "https://www.elastic.co/products/elasticsearch"
          - contains:
              message: '"type": "audit"'
    - pipeline: "filebeat-%{[agent.version]}-elasticsearch-slowlog-pipeline"
      when:
        and:
          - equals:
              container.labels.org_label-schema_url: "https://www.elastic.co/products/elasticsearch"
          - contains:  4️⃣
              message: '_slowlog'
    - pipeline: "filebeat-%{[agent.version]}-elasticsearch-gc-pipeline"
      when.equals:  5️⃣
        container.labels.org_label-schema_url: "https://www.elastic.co/products/elasticsearch"

setup.kibana:
  host: "http://kibana:5601"
1️⃣ You still need to add the Filebeat module for Elasticsearch. Otherwise, it wouldn’t create the ingest pipelines.
2️⃣ The ingest pipeline should only apply to Elasticsearch images. There are quite a few fields from add_docker_metadata to choose from, but one that should be unique and stable is container.labels.org_label-schema_url.
3️⃣ With the different log files, there are different formats, making this example one of the more complicated ones. The type field is a differentiator for server, deprecation, and audit.
4️⃣ Slowlogs have multiple type fields, and while you could have nested an additional or condition into this, but to keep it simple, the condition is only doing a partial match.
5️⃣ The GC log isn’t JSON and also doesn’t have a type field. This condition is a fallback rule since only the first matching pipeline for every log event is being executed.
This approach makes sense for connecting custom pipelines and log formats. And while this is an excellent example of learning about multiple container-related features of Filebeat and how to combine them, it is also horrible to write and maintain. Could there be a better approach for Filebeat modules?
Plan C: Docker Templates #
Instead of collecting logs manually from a specific folder, Filebeat supports autodiscover.providers for both docker and kubernetes. It uses the default location of logs automatically — like /var/lib/docker/containers/ from the previous example.
With Docker the following metadata fields are added to every log event:
hostportdocker.container.iddocker.container.imagedocker.container.namedocker.container.labels
The idea for this approach is to add a conditional template based on the metadata that applies the Filebeat modules. The complete filebeat.yml then contains:
filebeat.autodiscover.providers:
  - type: docker  1️⃣
    templates:
      - condition:
        contains:
          docker.container.image: elasticsearch  2️⃣
        config:
          - module: elasticsearch  3️⃣
            audit:
              input:
                type: container
                paths:
                  - "/var/lib/docker/containers/${data.docker.container.id}/*.log"  4️⃣
            deprecation:
              input:
                type: container
                paths:
                  - "/var/lib/docker/containers/${data.docker.container.id}/*.log"
            gc:
              input:
                type: container
                paths:
                  - "/var/lib/docker/containers/${data.docker.container.id}/*.log"
            server:
              input:
                type: container
                paths:
                  - "/var/lib/docker/containers/${data.docker.container.id}/*.log"
            slowlog:
              input:
                type: container
                paths:
                  - "/var/lib/docker/containers/${data.docker.container.id}/*.log"

output.elasticsearch:
  hosts: ["http://elasticsearch:9200"]

setup.kibana:
  host: "http://kibana:5601"
1️⃣ Using the docker provider, Filebeat must be able to access the Docker logs in their default location. For example with Docker Compose you need to mount volumes: [ /var/lib/docker/containers:/var/lib/docker/containers:ro ] into the Filebeat container. You can use the docker-compose.yml from the final plan D here as well.
2️⃣ Add a condition for this template based on the docker.container.image metadata.
3️⃣ Enable the Elasticsearch module and apply its five different log types on the Elasticsearch container. You don’t have to enable modules with filebeat.modules any more, since this line already does that.
4️⃣ Make sure you scope the template correctly. ${data.docker.container.id} applies the module only to the logs of the container matching the condition. /var/lib/docker/containers/*/*.log would apply the module to all the container logs for every Elasticsearch instance.
This approach is better than the previous one, but it contains a lot of boilerplate configuration. Could this get simpler?
Plan D: Back to Filebeat Modules #
hints are the key — quoting from the documentation:
The hints system looks for hints in Kubernetes Pod annotations or Docker labels that have the prefix
co.elastic.logs. As soon as the container starts, Filebeat checks if it contains any hints and launch the proper config for it. Hints tell Filebeat how to get logs for the given container.
The complete filebeat.yml configuration is now much shorter and cleaner:
filebeat.autodiscover.providers:
  - type: docker
    hints.enabled: true

filebeat.modules:  1️⃣
  - module: elasticsearch

output.elasticsearch:
  hosts: ["http://elasticsearch:9200"]

setup.kibana:
  host: "http://kibana:5601"
1️⃣ Don’t forget to enable the Filebeat module with this approach. Otherwise, it wouldn’t add the necessary ingest pipelines.
Now, how does this configuation apply the Filebeat module? Through Docker labels, for example in a docker-compose.yml file. It’s mostly a standard Elasticsearch and Kibana setup plus Filebeat — running as a sidecar on Docker or a daemonset on Kubernetes:
---
version: '3.3'
services:

  elasticsearch:
    container_name: elasticsearch
    hostname: elasticsearch
    image: docker.elastic.co/elasticsearch/elasticsearch:$ELASTIC_VERSION
    environment:
      - bootstrap.memory_lock=true
      - "ES_JAVA_OPTS=-Xms512m -Xmx512m"
      - discovery.type=single-node
    labels:
      co.elastic.logs/module: elasticsearch  1️⃣
    volumes:
      - esdata1:/usr/share/elasticsearch/data
    ports:
      - 9200:9200
    networks:
      - stack

  kibana:
    container_name: kibana
    hostname: kibana
    image: docker.elastic.co/kibana/kibana:$ELASTIC_VERSION
    labels:
      co.elastic.logs/module: kibana
    depends_on:
      - elasticsearch
    ports:
      - 5601:5601
    networks:
      - stack

  filebeat:
    container_name: filebeat
    hostname: filebeat
    image: docker.elastic.co/beats/filebeat:${ELASTIC_VERSION}
    user: root
    volumes:
      - ./filebeat.yml:/usr/share/filebeat/filebeat.yml:ro
      - /var/lib/docker/containers:/var/lib/docker/containers:ro  2️⃣
      - /var/run/docker.sock:/var/run/docker.sock:ro  3️⃣
    command: filebeat -e
    depends_on:
      - elasticsearch
      - kibana
    restart: on-failure
    networks:
      - stack

volumes:
  esdata1:
    driver: local
networks:
  stack:
1️⃣ The co.elastic.logs/module label tells Filebeat with autodiscovery, which Filebeat module to apply to this container. It is like an inversion of control: Rather than configuring the rules during collection, the container itself declares how its logs should be processed. There are additional rules you can apply like co.elastic.logs/multiline.*, co.elastic.logs/processors, or co.elastic.logs/enabled, but only the module one is required for this scenario.
2️⃣ Mounting the container logs into the sidecar so that Filebeat can access them.
3️⃣ The Docker socket needs to be mounted so Filebeat can read the co.elastic.logs annotations. Accessing the Docker socket also requires the container to run as root.
Finally, a .env file manages the Elastic Stack version centrally:
ELASTIC_VERSION=7.16.2
This is it. The Filebeat module applies its rules automatically to the Elasticsearch container, and the result shows up in Kibana:
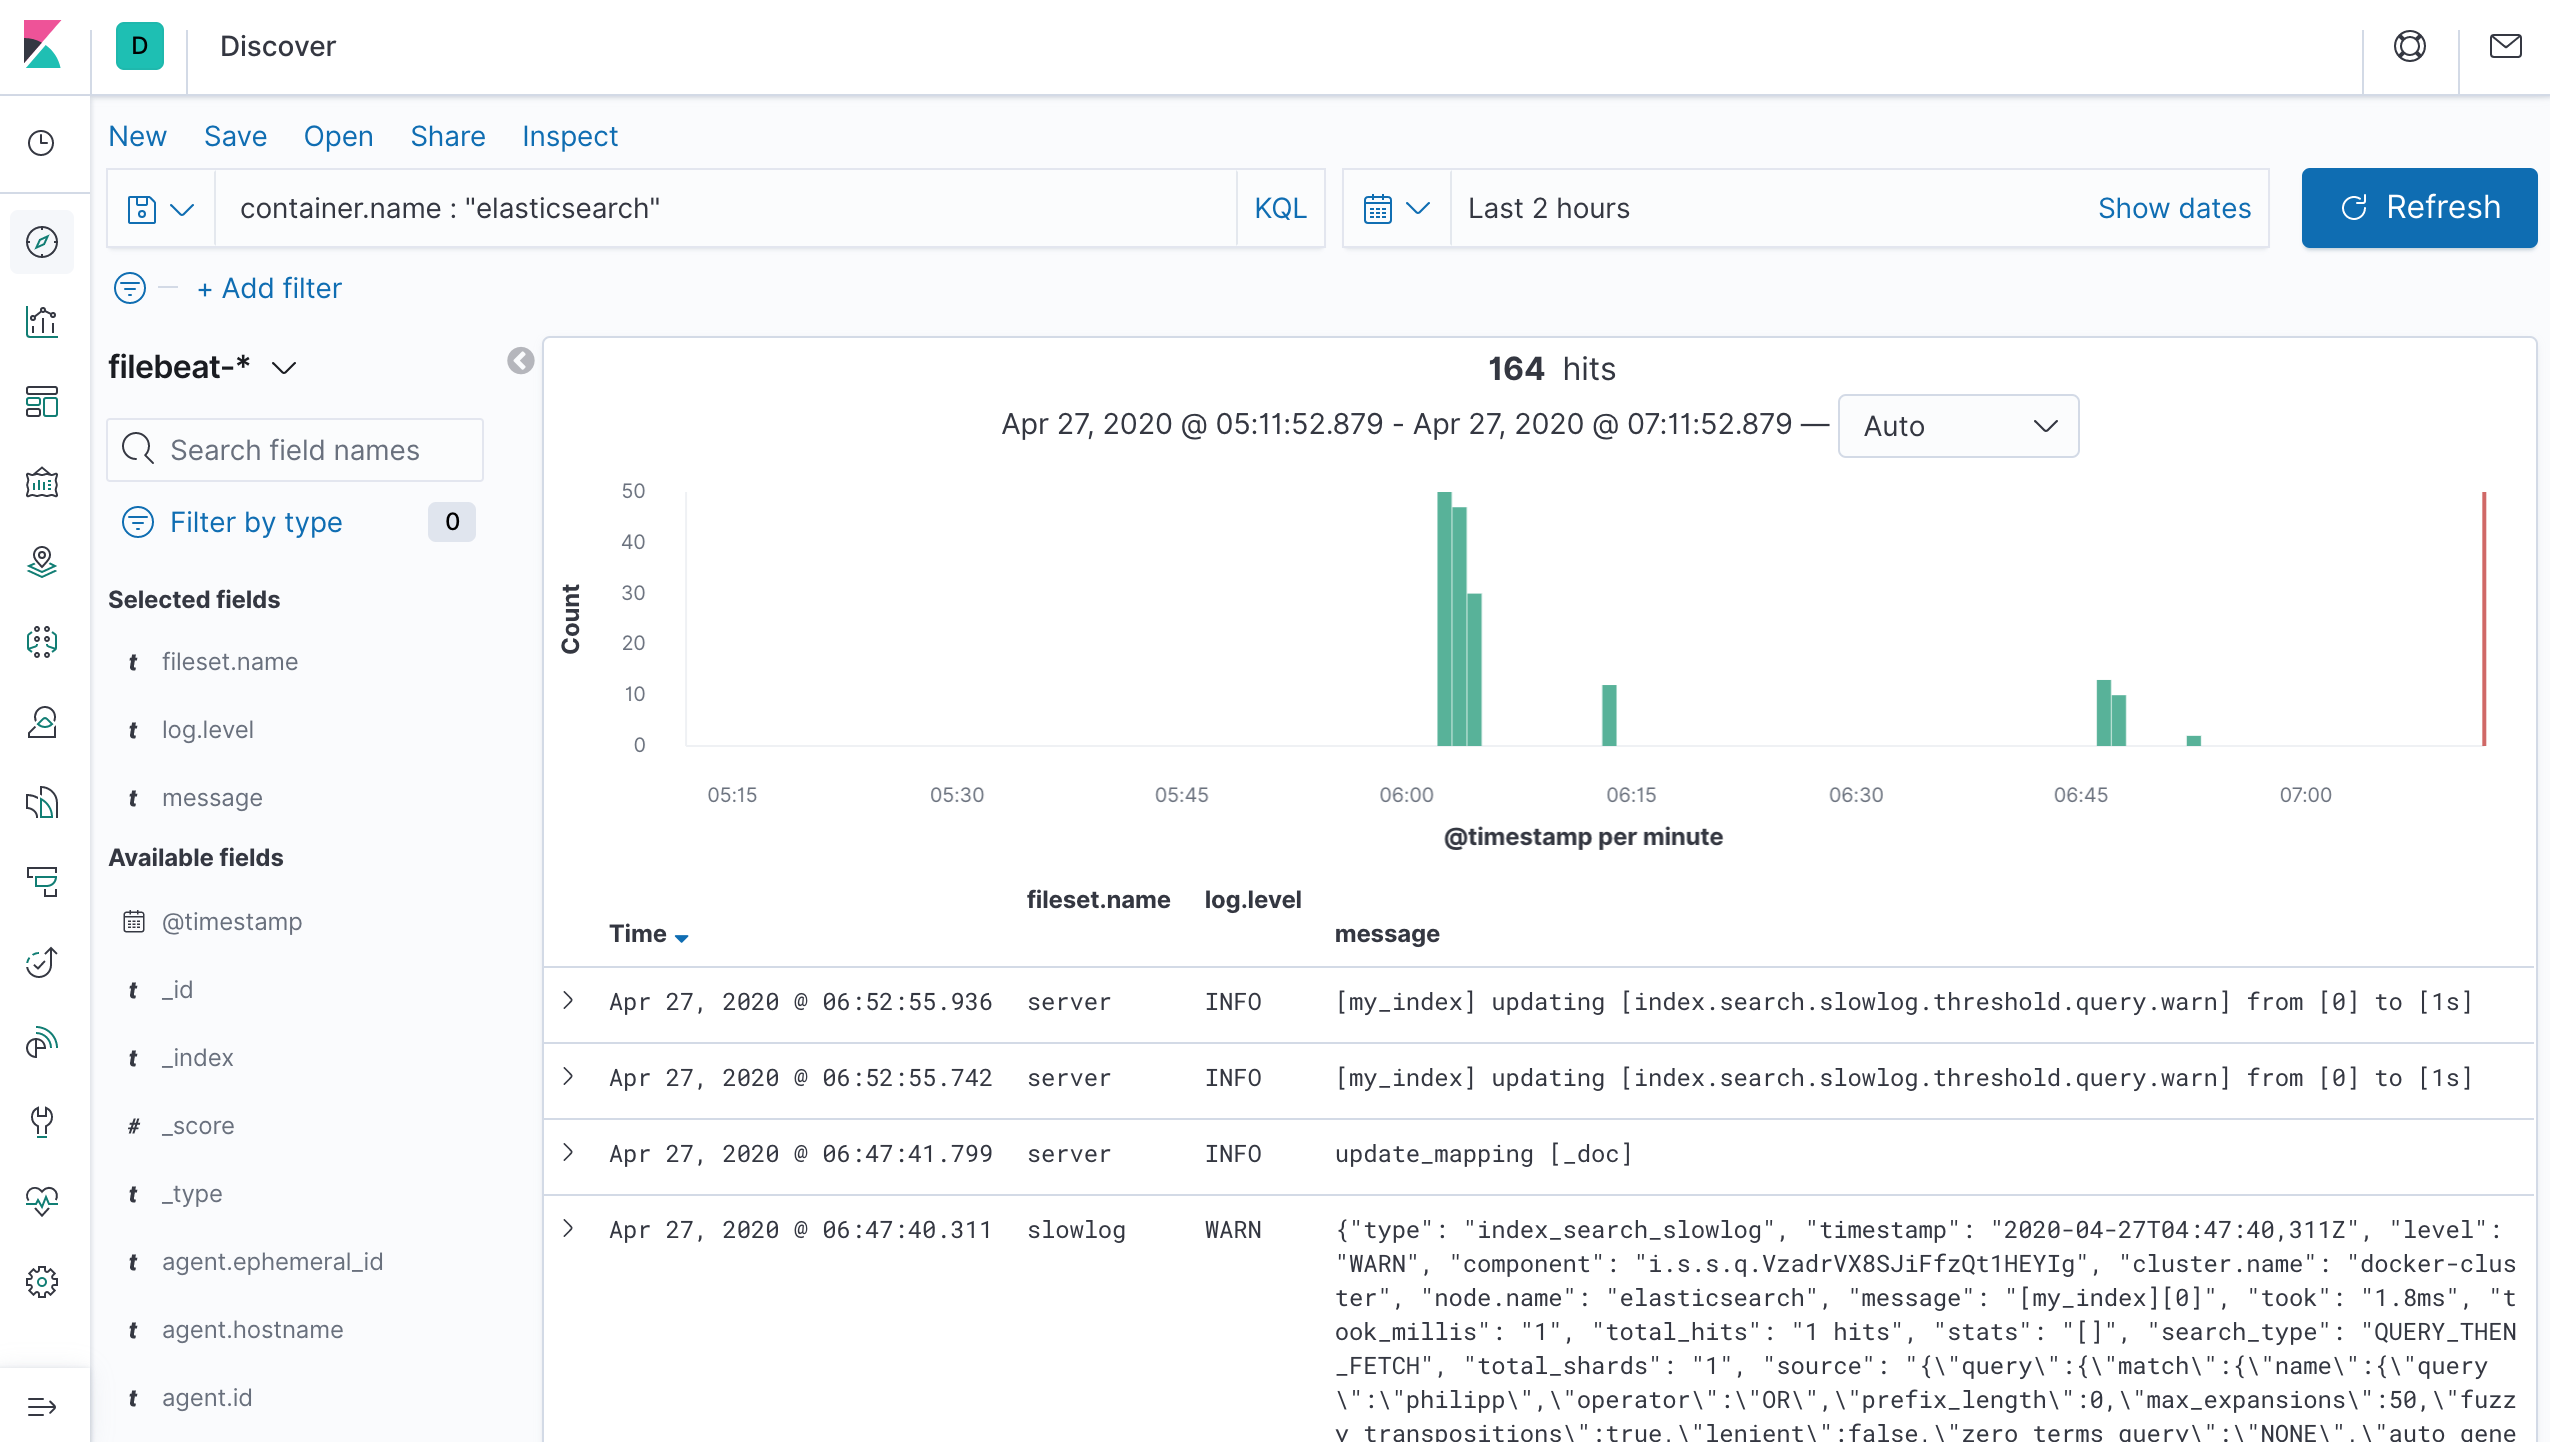
The full example of the final plan D approach is also on GitHub.
Conclusion #
Once you know what you are looking for, this is a straightforward problem to solve. But at first, moving from log files to STDOUT looks like a challenge, as shown in my failed plan A. Also, explicit processing rules only complicate log processing as you add log formats, which plan B covered. Plan C was relatively straightforward but requires a lot of boilerplate code — I’m not sure I would want to do this for 20 different Filebeat modules. Finally, with the change in paradigm that every container should define its own rules in plan D, the setup with Docker is not so different to log files again. After all, when creating the Docker image, you know the format, and you can roll out changes in a single place.
One final point for discussion: Adding a Docker label for logging on the container sounds like additional coupling. If many systems use a similar approach, you’ll end up with a soup of labels. That’s why they should be namespaced like co.elastic.logs/*. For me, this is an acceptable tradeoff, and I would rather have it than more boilerplate code. If you disagree, you can use the plan C approach instead.